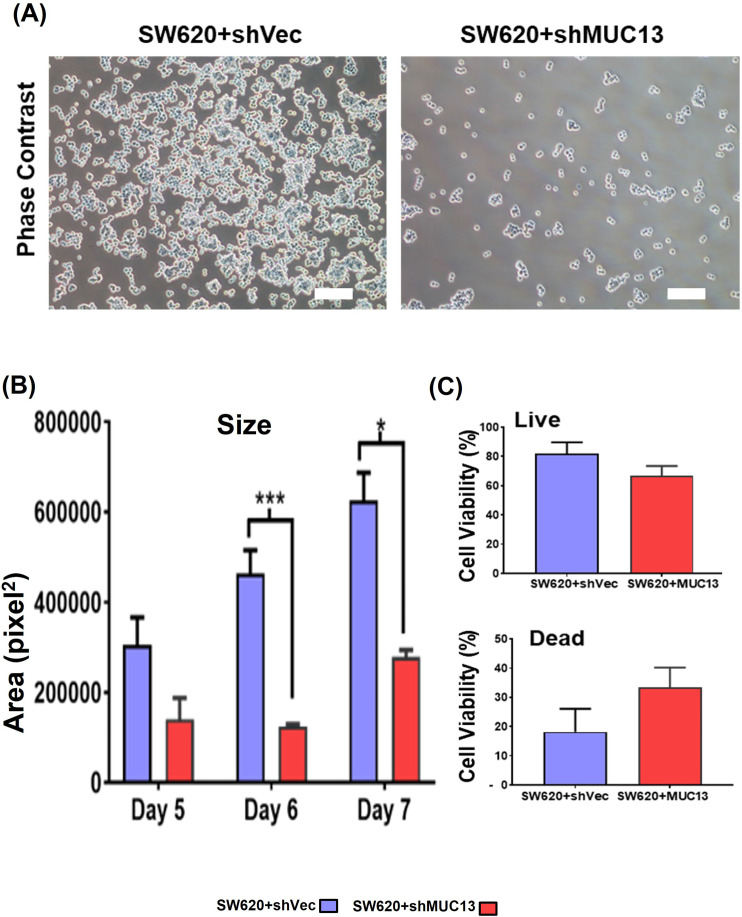
Figure S2. Repression of MUC13 inhibits anchorage-independent survival of cancer cells.
(A) Phase contrast images of the MUC13 knockdown cells (SW620+shCtrl and SW620+shMUC13 cells) after anchorage-independent growth (36 h) and re-plating on regular culture dishes. After 8 h, the cells were gently rinsed with PBS and imaged using a phase contrast microscope (scale bar, 20 μm). The images depict at least three independent experiments. (B) Quantification and size analysis of spheroids at days 5, 6, and 7. Unpaired t test, n = 3. Data are represented as mean ± SEM. *P < 0.05, **P < 0.01, and ***P < 0.001 denote significant differences. (C) Quantification of % live and dead cells in spheroids generated from SW620+shCtrl and SW620+shMUC13 at day 7 after anchorage-independent stimulation. Unpaired t test, n = 3. Data are represented as mean ± SEM. *P < 0.05, **P < 0.01, and ***P < 0.001 denote significant differences. In all panels, the data are representative of at least three individual experiments, and data represented as mean ± SEM. *P < 0.05, **P < 0.01, and ***P < 0.001 denote significant differences.

