Figure 2.
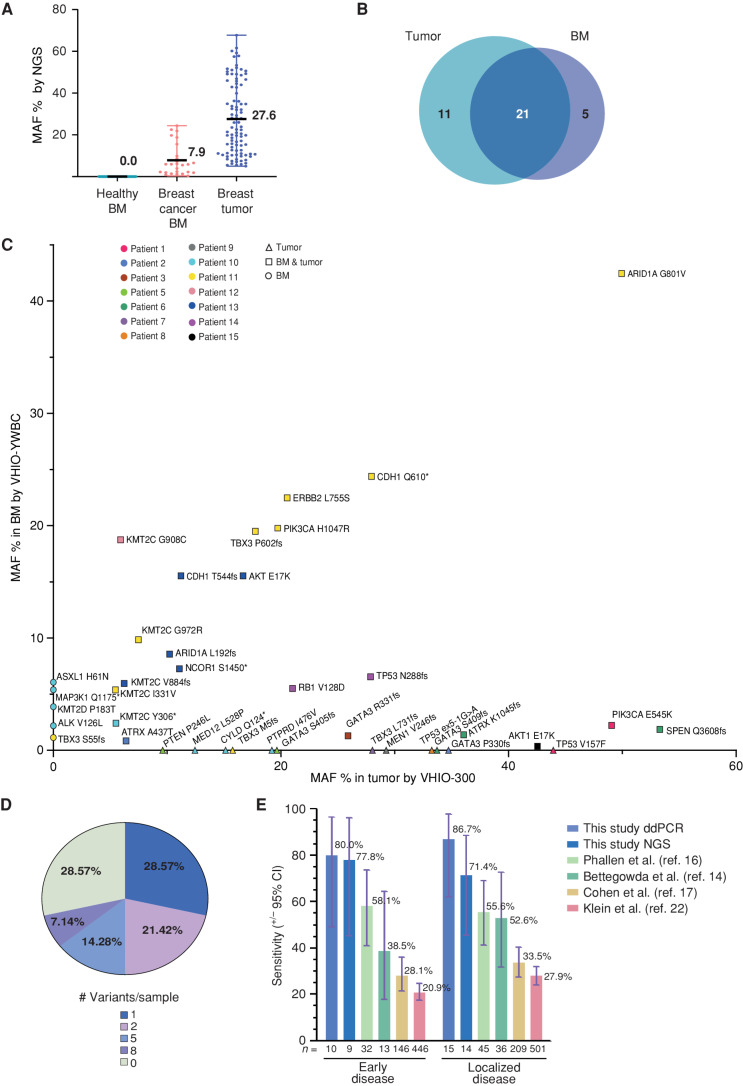
NGS-based detection of breast cancer in BM using a targeted sequencing assay. A, Variants detected by the NGS panel VHIO-YWBC in healthy BM (n = 0) and breast cancer BM (n = 26), as well as in tumor tissue with the VHIO-300 NGS panel (n = 94), represented as % of MAF. The mean and range are depicted in the chart. B, Number of variants detected in common between BM and matched tumor tissue from the case cohort, focusing only on genes captured by both the VHIO-YWBC and VHIO-300 panels. C, Variants detected by NGS in BM samples by VHIO-YWBC (y-axis) vs. variants detected by the VHIO-300 panel in formalin-fixed, paraffin embedded (FFPE) solid tumor biopsies (x-axis) only in genes common to both panels. Data are represented as MAF %. Color coding is used to discriminate patients. The shape of the symbols represents variants detected only in BM (circles), only in FFPE (triangles), or in both (squares). D, Percentage of cases according to the number of variants detected in BM by NGS (n = 14). E, Sensitivity of our ddPCR and NGS approaches for the detection of ctDNA in early (stages I–II) and localized (stages I–III) disease and compared with four reported methods for early breast cancer detection from plasma; data are represented as a percentage, with exact mean numbers and plus/minus a 95% confidence interval (CI).

