. 2023 Aug 7;13(10):2212–2227. doi: 10.1158/2159-8290.CD-22-0851

Figure 2.

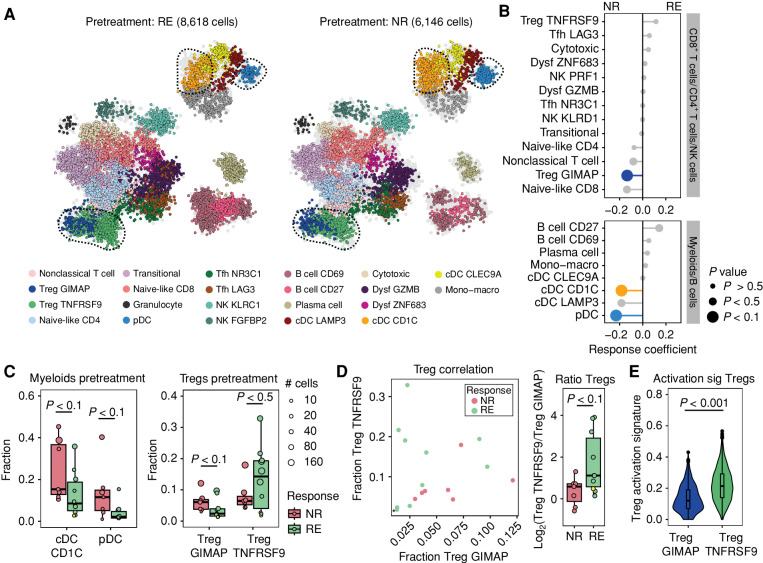
Figure 2. Pretreatment Treg activation state is associated with response to dual ICB. A, 2D projection of all immune cells from responding (RE) and nonresponding (NR) patients at baseline (n = 17, monotherapy-treated patient IMC-04 excluded). Cells are colored by cell state as in Fig. 1B. Cells from the opposite patient group are colored in light gray. Dysf, dysfunctional; Mono–macro, monocyte–macrophage. B, Predictive coefficient of the abundance of cell fractions for each cell state at baseline in responding vs. nonresponding patient groups. Size of the datapoints corresponds to the P value of the comparison between responding and nonresponding patients of the specific cell state, defined by a two-tailed Mann–Whitney U test. Populations that are differentially abundant (P < 0.1) between responding and nonresponding patients are colored by their cell state. C, Fraction of cDC CD1C and pDC (left) and the two Treg subsets (right) in nonresponding and responding patients at baseline. Datapoints from the one patient with a partial pathologic response (IMC-27) are marked in yellow. Boxes show the median and 25th and 75th percentiles. Whiskers depict 1.5  × interquartile range (IQR), and datapoints represent individual patients, sized by the number of cells that underlie that datapoint. A two-tailed Mann–Whitney U test was performed. D, Left: correlation between fractions of TregTNFRSF9 and TregGIMAP cells per patient at baseline, colored by response. IMC-27 is marked with an asterisk. Right: pretreatment ratio of TregTNFRSF9 over TregGIMAP fraction within total T cells per patient, depicted as the log fold ratio in fraction. Boxes show the median and 25th and 75th percentiles. Whiskers depict 1.5  × IQR, and datapoints represent individual patients, IMC-27 is marked in yellow. A two-tailed Mann–Whitney U test was performed. E, Expression of a Treg activation signature (sig; ref. 32) in TregTNFRSF9 and TregGIMAP cells across all patients at baseline. Log normalized expression of activation-related transcripts is depicted, and a two-tailed Mann–Whitney U test was performed.

Pretreatment Treg activation state is associated with response to dual ICB. A, 2D projection of all immune cells from responding (RE) and nonresponding (NR) patients at baseline (n = 17, monotherapy-treated patient IMC-04 excluded). Cells are colored by cell state as in Fig. 1B. Cells from the opposite patient group are colored in light gray. Dysf, dysfunctional; Mono–macro, monocyte–macrophage. B, Predictive coefficient of the abundance of cell fractions for each cell state at baseline in responding vs. nonresponding patient groups. Size of the datapoints corresponds to the P value of the comparison between responding and nonresponding patients of the specific cell state, defined by a two-tailed Mann–Whitney U test. Populations that are differentially abundant (P < 0.1) between responding and nonresponding patients are colored by their cell state. C, Fraction of cDC CD1C and pDC (left) and the two Treg subsets (right) in nonresponding and responding patients at baseline. Datapoints from the one patient with a partial pathologic response (IMC-27) are marked in yellow. Boxes show the median and 25th and 75th percentiles. Whiskers depict 1.5  × interquartile range (IQR), and datapoints represent individual patients, sized by the number of cells that underlie that datapoint. A two-tailed Mann–Whitney U test was performed. D, Left: correlation between fractions of TregTNFRSF9 and TregGIMAP cells per patient at baseline, colored by response. IMC-27 is marked with an asterisk. Right: pretreatment ratio of TregTNFRSF9 over TregGIMAP fraction within total T cells per patient, depicted as the log fold ratio in fraction. Boxes show the median and 25th and 75th percentiles. Whiskers depict 1.5  × IQR, and datapoints represent individual patients, IMC-27 is marked in yellow. A two-tailed Mann–Whitney U test was performed. E, Expression of a Treg activation signature (sig; ref. 32) in TregTNFRSF9 and TregGIMAP cells across all patients at baseline. Log normalized expression of activation-related transcripts is depicted, and a two-tailed Mann–Whitney U test was performed.