. 2023 Jul 25;13(10):2192–2211. doi: 10.1158/2159-8290.CD-23-0050

Figure 3.

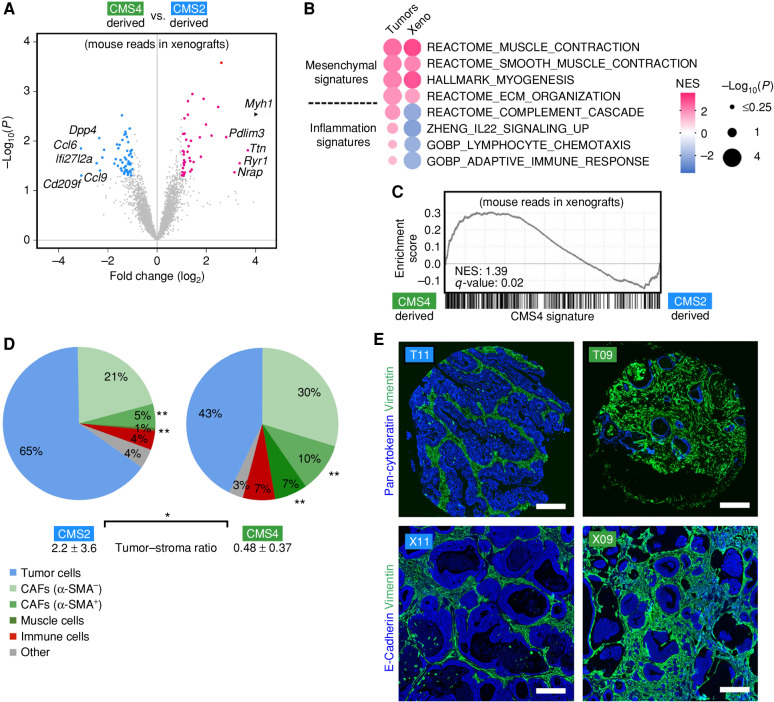
Figure 3. Organoid xenotransplantation elicits a subtype-specific stromal response. A, Differential analysis of stromal gene expression after xenotransplantation of CMS2-derived (n = 4) and CMS4-derived (n = 5) organoids in NSG mice. Volcano plot of mouse transcripts (base mean expression ≥10). Significantly changed genes (P < 0.05) are colored. B and C, GSEA of differential expression in CMS2 vs. CMS4 tumors and corresponding PDTO xenografts (mouse reads). MSigDB signatures for fibroblasts and inflammation (B) and the CMS4 signature (C) were studied. Normalized enrichment score (NES) and P values are shown. D, Multifluorescent analysis of the TME of matched TMA. Quantification of diverse cell populations. CAFs were defined by VIM expression and grouped into α-SMA–positive and α-SMA–negative cells. Significant changes between CMS2 (n = 9) and CMS4 tumors (n = 7) are labeled (*, P < 0.05; **, P < 0.01; Mann–Whitney U test). The tumor–stroma ratio was determined after image-based tissue segmentation (mean ± SD). E, Histologic analysis of TMA stained for pan-cytokeratin and Vimentin (top) and tumors obtained after xenotransplantation of matched PDTOs (bottom) stained for E-Cadherin and Vimentin. Staining was replicated in ≥2 animals each. All scale bars are 200 μm. See Supplementary Fig. S6.

Organoid xenotransplantation elicits a subtype-specific stromal response. A, Differential analysis of stromal gene expression after xenotransplantation of CMS2-derived (n = 4) and CMS4-derived (n = 5) organoids in NSG mice. Volcano plot of mouse transcripts (base mean expression ≥10). Significantly changed genes (P < 0.05) are colored. B and C, GSEA of differential expression in CMS2 vs. CMS4 tumors and corresponding PDTO xenografts (mouse reads). MSigDB signatures for fibroblasts and inflammation (B) and the CMS4 signature (C) were studied. Normalized enrichment score (NES) and P values are shown. D, Multifluorescent analysis of the TME of matched TMA. Quantification of diverse cell populations. CAFs were defined by VIM expression and grouped into α-SMA–positive and α-SMA–negative cells. Significant changes between CMS2 (n = 9) and CMS4 tumors (n = 7) are labeled (*, P < 0.05; **, P < 0.01; Mann–Whitney U test). The tumor–stroma ratio was determined after image-based tissue segmentation (mean ± SD). E, Histologic analysis of TMA stained for pan-cytokeratin and Vimentin (top) and tumors obtained after xenotransplantation of matched PDTOs (bottom) stained for E-Cadherin and Vimentin. Staining was replicated in ≥2 animals each. All scale bars are 200 μm. See Supplementary Fig. S6.