. 2023 Jul 25;13(10):2192–2211. doi: 10.1158/2159-8290.CD-23-0050

Figure 7.

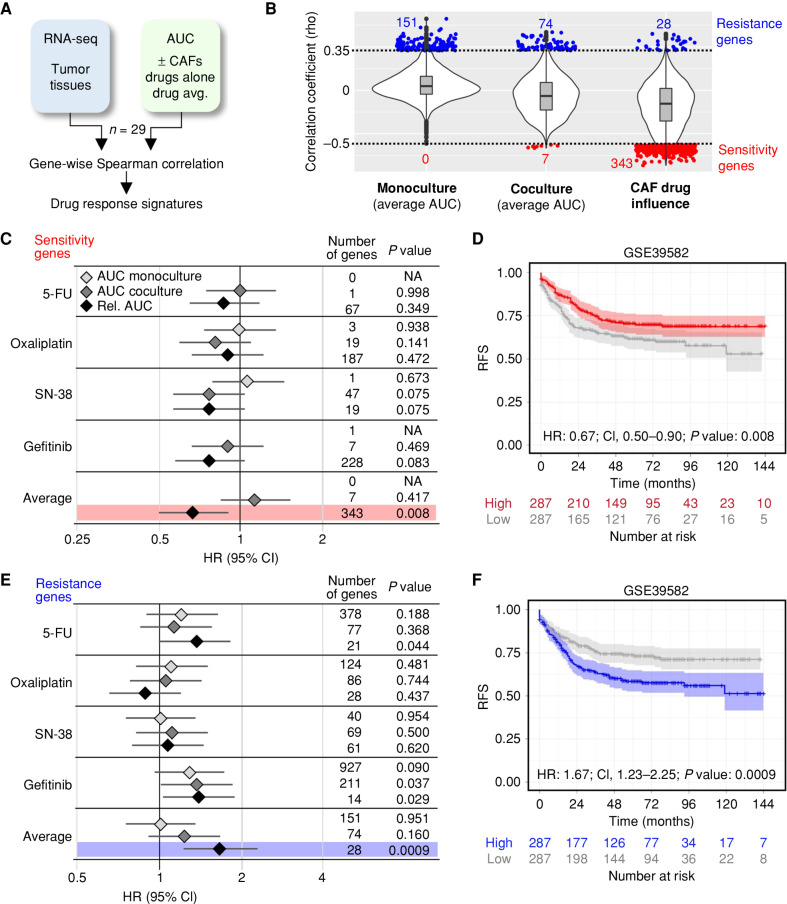
Figure 7. Drug response in the organoid–stroma biobank is linked to distinct colorectal cancer patient outcomes. A, Strategy for the identification of pharmacotranscriptomic signatures (see Methods). B, Violin plots show the transcriptome-wide distribution of Spearman correlation coefficients (rho). Sensitivity (red) and resistance (blue) genes were filtered (rho < −0.5, rho >0.35, and P < 0.05, respectively). Correlations to the absolute response in monocultures and in cocultures (average AUC of 5-FU, oxaliplatin, SN-38, and gefitinib) and the relative response (AUCco/AUCmono) defined as CAF drug influence. C and D, Prognostic value of signatures linked with drug sensitivity. A public cohort (GSE39582) was divided into high- and low-expression groups. C, Forest plot shows HR with 95% confidence interval (CI) for RFS in the high-expression group. Signatures were derived from AUC in monoculture, coculture, and relative change (AUCco/AUCmono) from each drug alone and from the average. For each signature, the number of genes and log-rank statistics (P value) are listed. NA, no correlated genes were present in GSE39582. D, Kaplan–Meier plot for high (red) and low (gray) expression of the sensitivity signature (CAF drug influence). E and F, Prognostic value of genes linked to drug resistance. Data are shown as above. F, Kaplan–Meier analysis with resistance signature derived from CAF drug influence. P values for C–F were calculated using a univariate log-rank test. See Supplementary Fig. S12 and Supplementary Table S11.

Drug response in the organoid–stroma biobank is linked to distinct colorectal cancer patient outcomes. A, Strategy for the identification of pharmacotranscriptomic signatures (see Methods). B, Violin plots show the transcriptome-wide distribution of Spearman correlation coefficients (rho). Sensitivity (red) and resistance (blue) genes were filtered (rho < −0.5, rho >0.35, and P < 0.05, respectively). Correlations to the absolute response in monocultures and in cocultures (average AUC of 5-FU, oxaliplatin, SN-38, and gefitinib) and the relative response (AUCco/AUCmono) defined as CAF drug influence. C and D, Prognostic value of signatures linked with drug sensitivity. A public cohort (GSE39582) was divided into high- and low-expression groups. C, Forest plot shows HR with 95% confidence interval (CI) for RFS in the high-expression group. Signatures were derived from AUC in monoculture, coculture, and relative change (AUCco/AUCmono) from each drug alone and from the average. For each signature, the number of genes and log-rank statistics (P value) are listed. NA, no correlated genes were present in GSE39582. D, Kaplan–Meier plot for high (red) and low (gray) expression of the sensitivity signature (CAF drug influence). E and F, Prognostic value of genes linked to drug resistance. Data are shown as above. F, Kaplan–Meier analysis with resistance signature derived from CAF drug influence. P values for CF were calculated using a univariate log-rank test. See Supplementary Fig. S12 and Supplementary Table S11.