FIGURE 2:
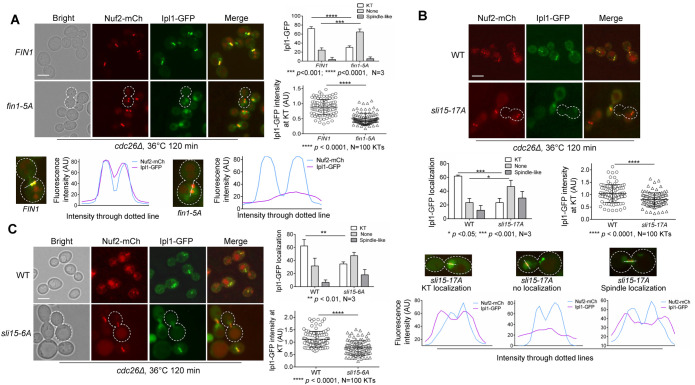
Sli15 dephosphorylation promotes CPC disassociation from KTs in metaphase. (A) Premature KT localization of Fin1 removes CPC from KTs in metaphase cells. cdc26Δ IPL1-3GFP NUF2-mCherry (4421-3-2) cells containing either FIN1 (pMB6) or fin1-5A (pMB7) plasmids were grown to log phase in YPD at 25°C then shifted to 36°C for 2 h for metaphase arrest. Samples were collected for imaging. Ipl1 localization was categorized as no KT localization, KT localization, or spindle localization. A cell representing loss of Ipl1 KT localization is outlined with white dotted line. Scale bar, 5 μm. The experiment was repeated three times (N = 3), and 100 cells were counted for each experiment. The bars represent mean values ± SD (top right). p values were obtained by using a two-tailed unpaired t test, with asterisks indicating *p < 0.05, **p < 0.01, ***p < 0.001, and **** p < 0.0001. The intensity of Ipl1 relative to Nuf2 in 50 cells (100 KTs) was quantified using ImageJ as described in the Materials and Methods (bottom right). Statistical significance for relative Ipl1 intensity was analyzed by a two-tailed unpaired t test, with asterisks indicating *p < 0.05, **p < 0.01, ***p < 0.001, and **** p < 0.0001. Colocalization of Ipl1 with Nuf2 in representative cells expressing FIN1 or fin1-5A was quantified and plotted using ImageJ (bottom). (B) Abolishment of Ipl1-dependent phosphorylation in Sli15 reduces KT localization of CPC in metaphase cells. cdc26Δ IPL1-3GFP NUF2-mCherry (4421-3-2) and sli15-17A cdc26Δ IPL1-3GFP NUF2-mCherry (4437-1-3) cells were subjected to the same experiment as in panel A. A cell representing loss of Ipl1 KT localization is outlined with white dotted line. Scale bar, 5 μm. The pictures are representative of three experimental repeats where 100 cells were counted for each experiment. The statistical analysis of Ipl1 KT localization and Ipl1 intensity at KTs is the same as described in panel A. Representative cells for each of the three Ipl1 localization categories in WT and sli15-17A strains were quantified and plotted using ImageJ (bottom). (C) Abolishment of CDK-dependent phosphorylation in Sli15 reduces KT localization of CPC in metaphase cells. cdc26Δ IPL1-3GFP NUF2-mCherry (4421-3-2) and sli15-6A cdc26Δ IPL1-3GFP NUF2-mCherry (4426-5-3) cells were subjected to the same experiment as in panel A. A cell representing loss of Ipl1 KT localization was outlined with white dotted line. Scale bar, 5 μm. The pictures are representative of three experimental repeats. See above for the statistical analysis for the KT localization and intensity of Ipl1.

