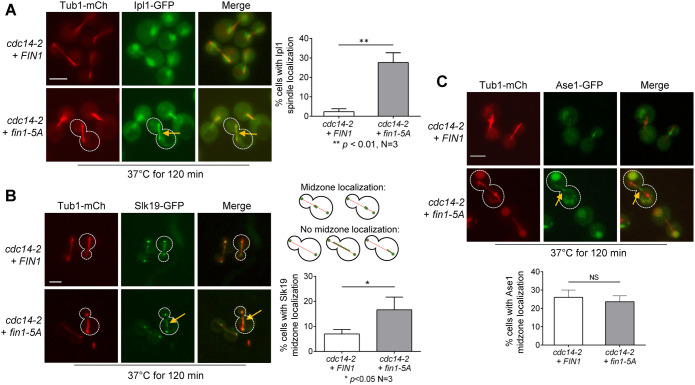
FIGURE 3:
Fin1-PP1 promotes CPC translocation in cells with inactive Cdc14. (A) Premature KT localization of Fin1-PP1 promotes Ipl1 translocation to the spindle in cdc14-2 mutants. cdc14-2 IPL1-3GFP TUB1-mCherry cells (4052-9-2) containing either FIN1 (pMB6) or fin1-5A (pMB7) plasmids were grown to log phase in synthetic dropout medium at 25°C then shifted to 37°C for 2 h to inactivate Cdc14. Colocalization of Ipl1 with spindle (Tub1-mCherry) was quantified. Yellow arrows represent Ipl1 spindle localization in the cell outlined with white-dotted line. Scale bar, 5 μm. The pictures are representative of three experimental repeats (N = 3) where 100 cells were counted for each experiment. The bars represent mean values ± SD. p values were obtained by using a two-tailed unpaired t test, with asterisks indicating *p < 0.05, **p < 0.01, ***p < 0.001, and ****p < 0.0001. (B) fin1-5A restores Slk19 midzone localization in cdc14-2 cells. cdc14-2 SLK19-GFP TUB1-mCherry cells (4210-1-2) containing either FIN1 (pMB6) or phospho-deficient fin1-5A (pMB7) plasmids were grown to log-phase in YPD at 25°C then shifted to 37°C for 2 h to inactivate Cdc14. The percentage of cells with Slk19 midzone localization was quantified. The guide for counting midzone localization is shown in the schematic. Representative cells are outlined in white, with yellow arrows representing Slk19 midzone localization. Scale bar, 5 μm. The pictures are representative of three experimental repeats (N = 3) where 100 cells were counted for each experiment. The bars represent mean values ± SD. p values were obtained by using a two-tailed unpaired t test, with asterisks indicating *p < 0.05, **p < 0.01, ***p < 0.001, and ****p < 0.0001. (C) fin1-5A does not restore Ase1 midzone localization in cdc14-2 cells. cdc14-2 ASE1-GFP TUB1-mCherry cells (4209-1-1) containing either FIN1 (pMB6) or fin1-5A (pMB7) plasmids were subjected to the same experiment as in panel B. The percentage of Ase1 midzone localization was quantified. The guide for counting midzone localization is shown in the schematic in panel B. Yellow arrows represent Ase1 midzone localization in the cell outlined with white dotted line. Scale bar, 5 μm. The pictures are representative of three experimental repeats. The statistical analysis was performed as described above.

