FIGURE 5:
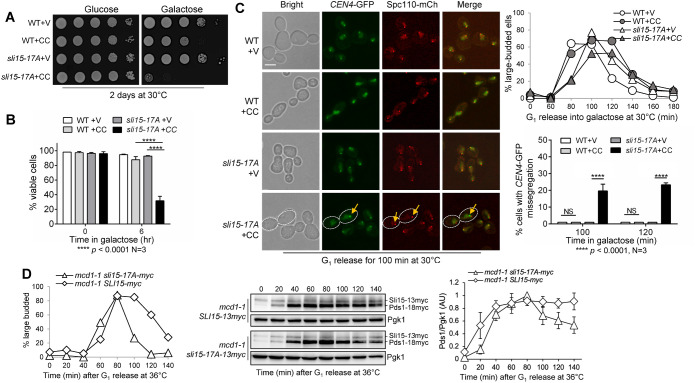
Phospho-deficient sli15-17A mutant cells show defective checkpoint in response to syntelic attachment induced by CIK1-CC overexpression. (A) Phospho-deficient sli15-17A cells show sick growth when CIK1-CC is overexpressed. WT (Y300) and sli15-17A (4368-3-1) cells with either an empty vector control (V, p1218) or PGALCIK1-CC (CC, pHL002) were grown to saturation then 10fold serially diluted and spotted onto glucose and galactose plates. The plates were incubated at 30°C for 2 d before imaging. (B) sli15-17A mutant cells show severe viability loss after CIK1-CC overexpression. The same strains used in panel A were grown to log-phase in raffinose media at 25°C. Galactose was added to a final concentration of 2% to induce CIK1-CC overexpression. Samples were taken at time 0 and after 6 h, and then spread on a YPD plate. The plating efficiency (viability) was examined after overnight incubation at 25°C. The experiment was repeated three times (N = 3) where 300 cells were counted for each experiment. The bars represent mean values ± SD. p values were obtained by using a two-tailed unpaired t test, with asterisks indicating **** p < 0.0001. (C) sli15-17A mutant cells show increased chromosome missegregation when syntelic attachment is induced. WT (4379-3-3) and sli15-17A (4368-3-1) strains containing CEN4-GFP and Spc110-mCherry with either vector control (V, p1218) or PGALCIK1-CC (CC, pHL002) were arrested in G1 in raffinose media at 30°C. Cells were released into 2% galactose media to induce CIK1-CC overexpression, and samples were collected for budding index (N = 100 cells, top, right). Pictures were taken at 100 and 120 min to determine the rate of chromosome missegregation for 100 cells. The yellow arrow points to chromosome missegregation in a representative cell with white dotted boundary. Scale bar, 5 μm. The pictures are representative of three experimental repeats (N = 3) where 100 cells were counted for each experiment. The bars represent mean values ± SD. p values were obtained by using a two-tailed unpaired t test, with asterisks indicating **** p < 0.0001. (D) Abolishment of Ipl1-dependent Sli15 phosphorylation in sli15-17A cells causes a tension checkpoint defect. mcd1-1 sli15-13myc (4517-1-2) and mcd1-1 sli15-17A-13myc (4505-4-3) cells with Pds1-18myc were arrested in G1 in YPD medium at 25°C, and then released into the cell cycle at 36°C. Cells were collected every 20 min for budding index (N = 100 cells; left), and for the detection of Pds1 protein level with anti-myc antibody (center). Pgk1, loading control. We used ImageJ to acquire the intensity of each Pds1 band from western blotting images from three independent time courses and mean values ± SD are plotted (right). Pds1 levels were normalized to the loading control (Pgk1) and are shown relative to 80 min following G1 release, where Pds1 levels peak.

