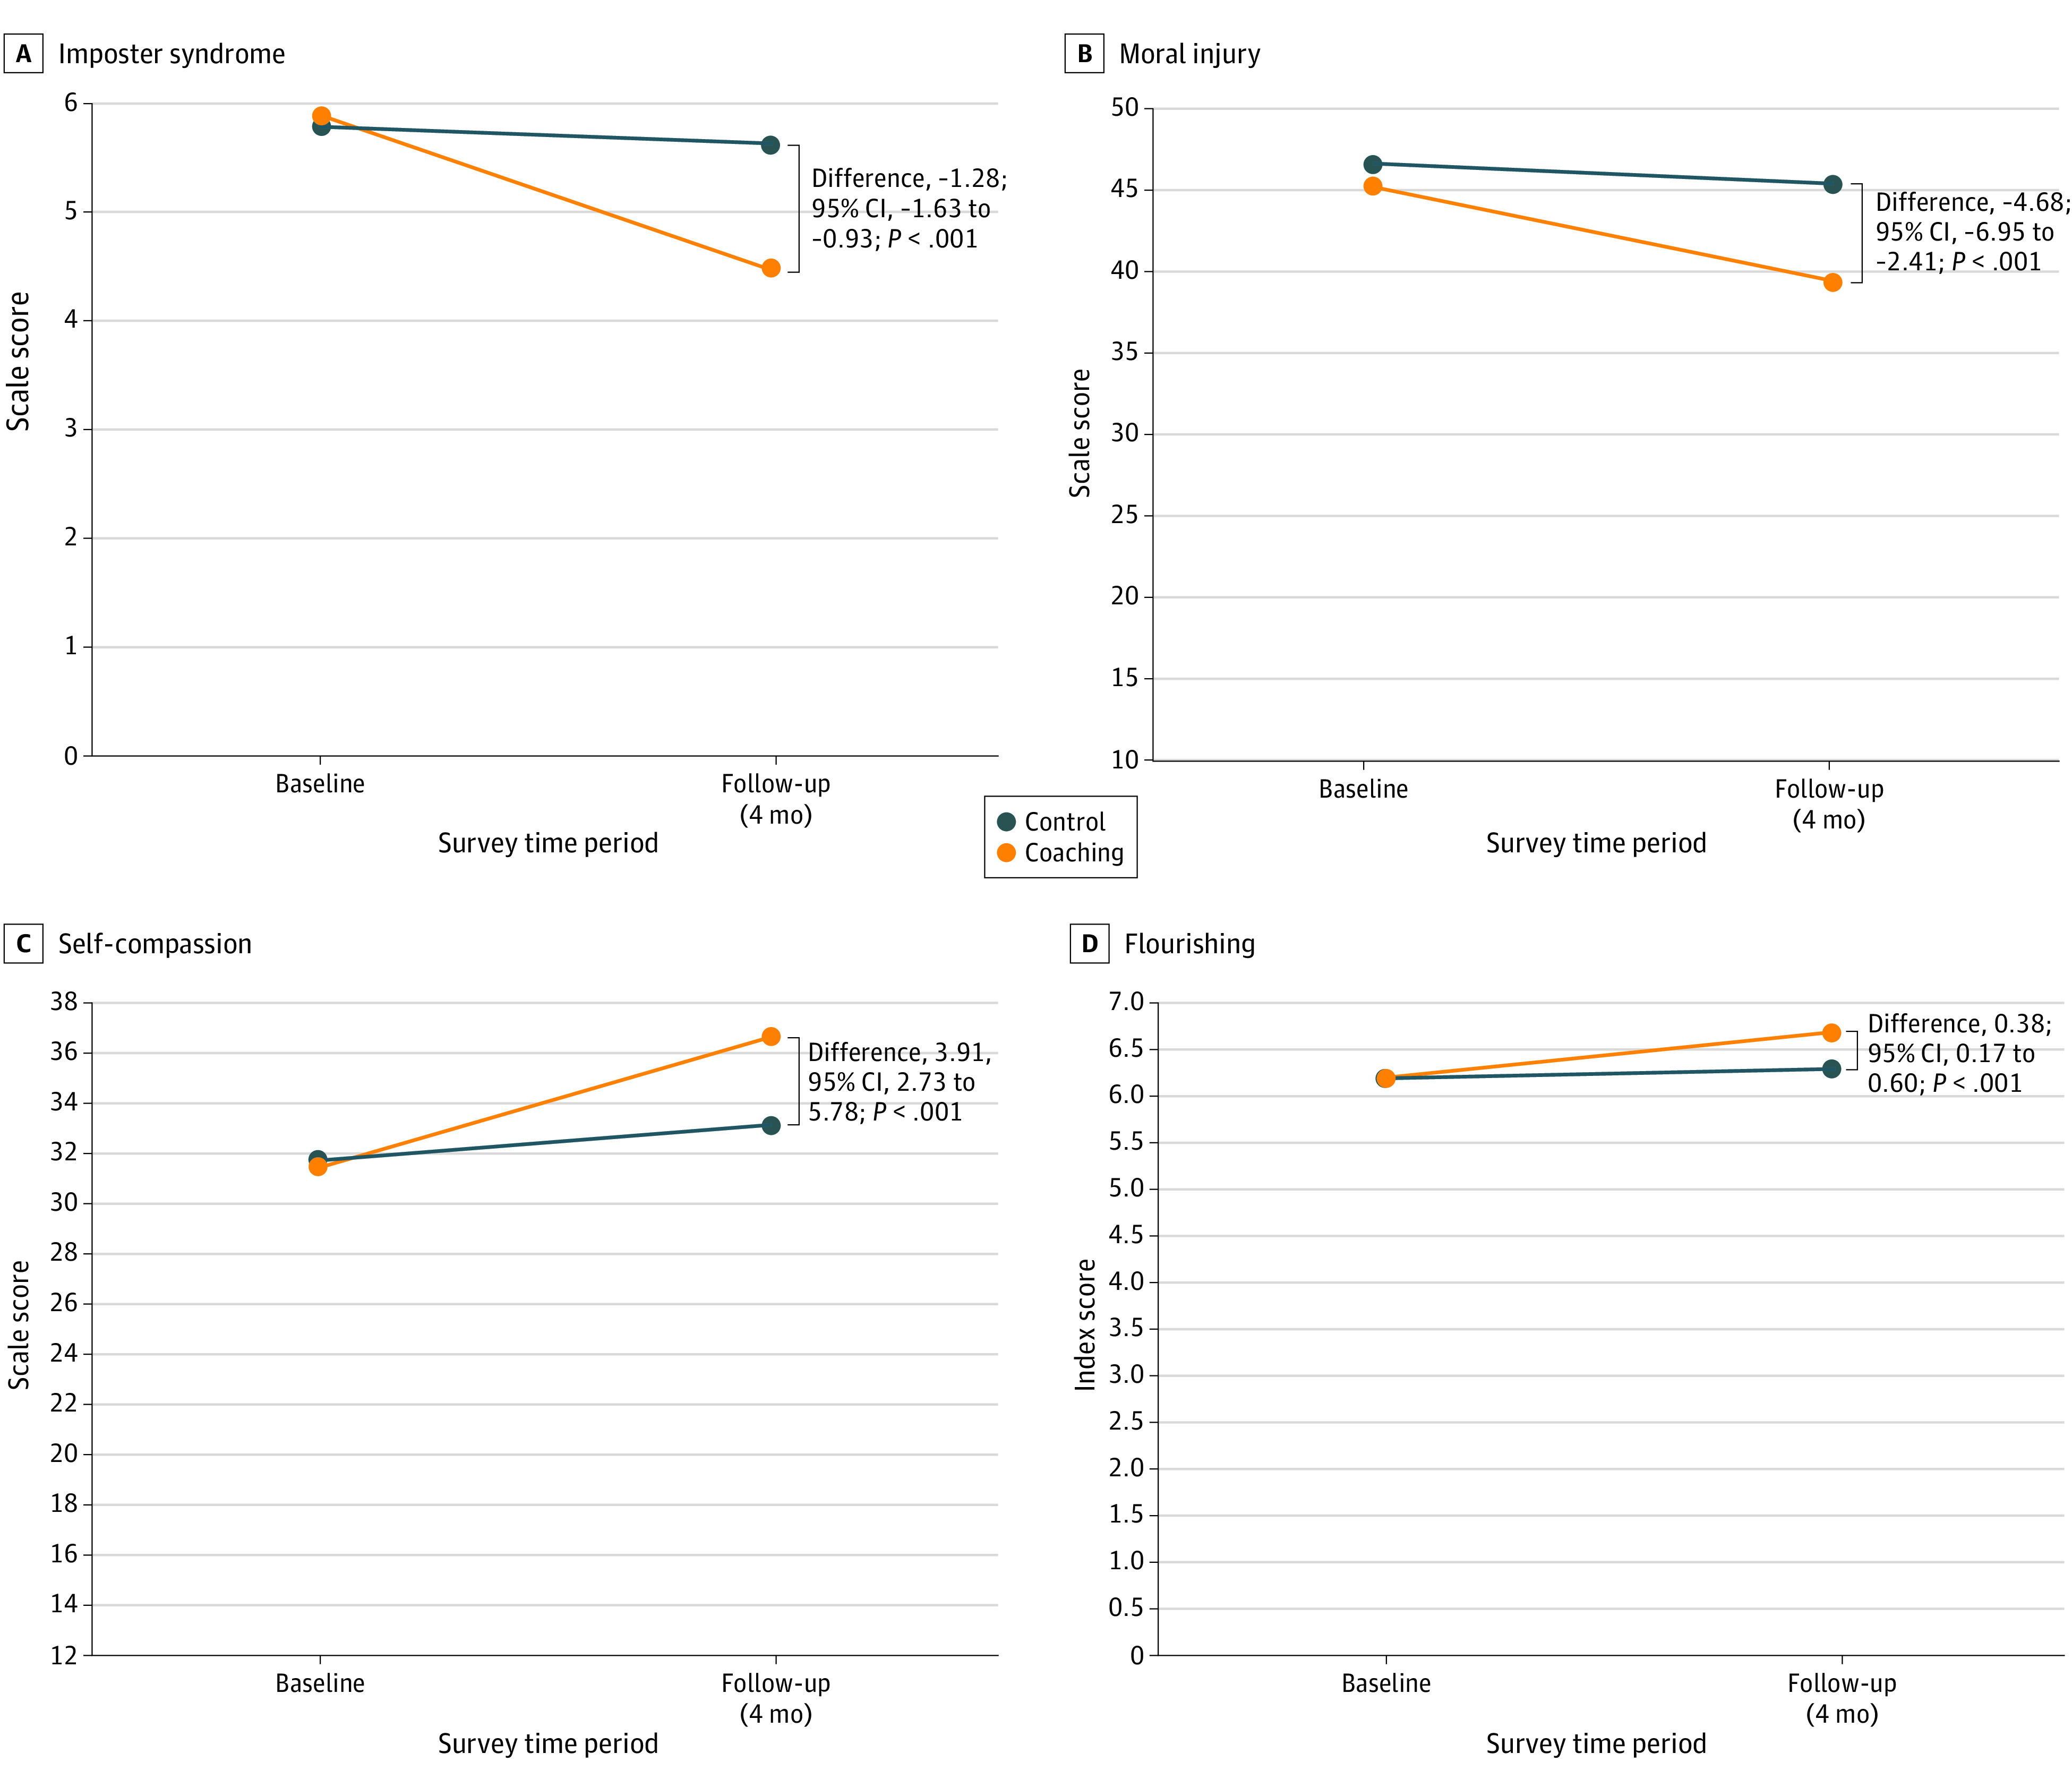
Figure 3. Mean Change in Secondary Outcome Response From Baseline Visit, Estimated From Linear Mixed Effects Models.

The figure shows the change in score for both the control group and intervention group from baseline to follow-up for Impostor syndrome (A), moral injury (B), self-compassion (C), and flourishing (D).
