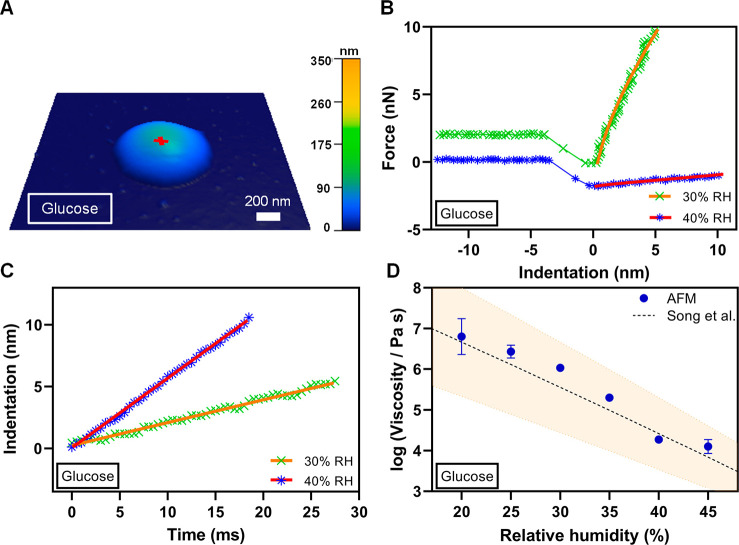
Figure 1.
(A) Representative AFM 3D height image at ∼10% RH of a single glucose particle displaying rounded morphology with the height of ca. 100 nm and base size of 1100 nm. The red cross corresponds to an approximate center of the particle where force measurements were performed. (B) Measured force versus indentation distance data (symbols) along with the fit line using eq 3 at 30% RH (green crosses and orange line) and 40% RH (blue asterisks and red line). The force data at 30% RH were offset by 2 nN for clarity. Only approach to the particle surface data is shown. (C) Measured indentation distance versus time (symbols) along with the linear fit line at 30% RH (green crosses and orange line) and 40% RH (blue asterisks and red line) used to quantify the first derivative of indentation distance with respect to time. (D) Viscosity quantified from the AFM force measurements (blue circles are average values and error bars are two standard deviations) as a function of RH at room temperature (20–25 °C) along with the expected values from Song et al.30 (black dashed line), Copyright 2016 American Chemical Society, where orange shadow area represents ±10% uncertainty. For some viscosity data points, the standard deviation is smaller than the size of the symbol.

