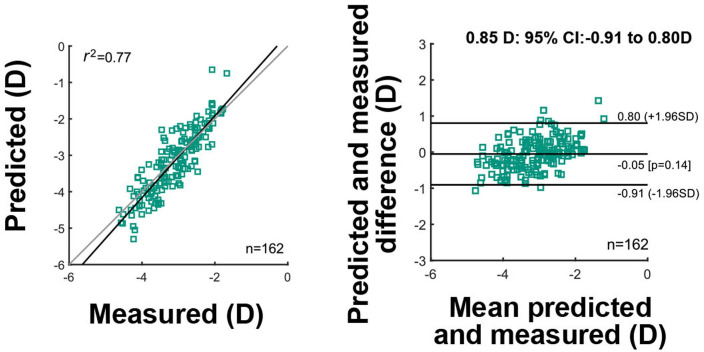
Figure 2.
Validation diagrams for the selected algorithm that combines an linear support vector regression model with a Matern Gaussian process regression model. The left diagram shows the prediction as a function of the measured data for the total sample size of 162. Pearson correlation value r2 and the sample size of 162 data points are also shown. The right diagram shows the difference between prediction and measurement as a function of their mean. Additionally, a bias of −0.05 D (p:0.14) and limits of agreement of 0.85 D (95% CI: −0.91 to 0.80) are shown.

