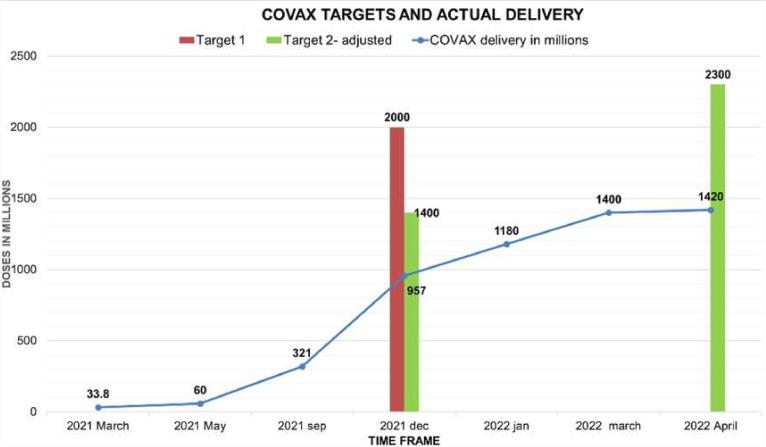
Figure 1.
In the primary axis of the graph, the x-axis denotes COVAX-delivered doses in millions, and the y-axis depicts the time frame from March 2021 to April 2022. The data were taken from the UNICEF vaccine market dashboard. COVAX targets for December 2021, both initial and adjusted and that for April 2022 were plotted on the secondary axis.

