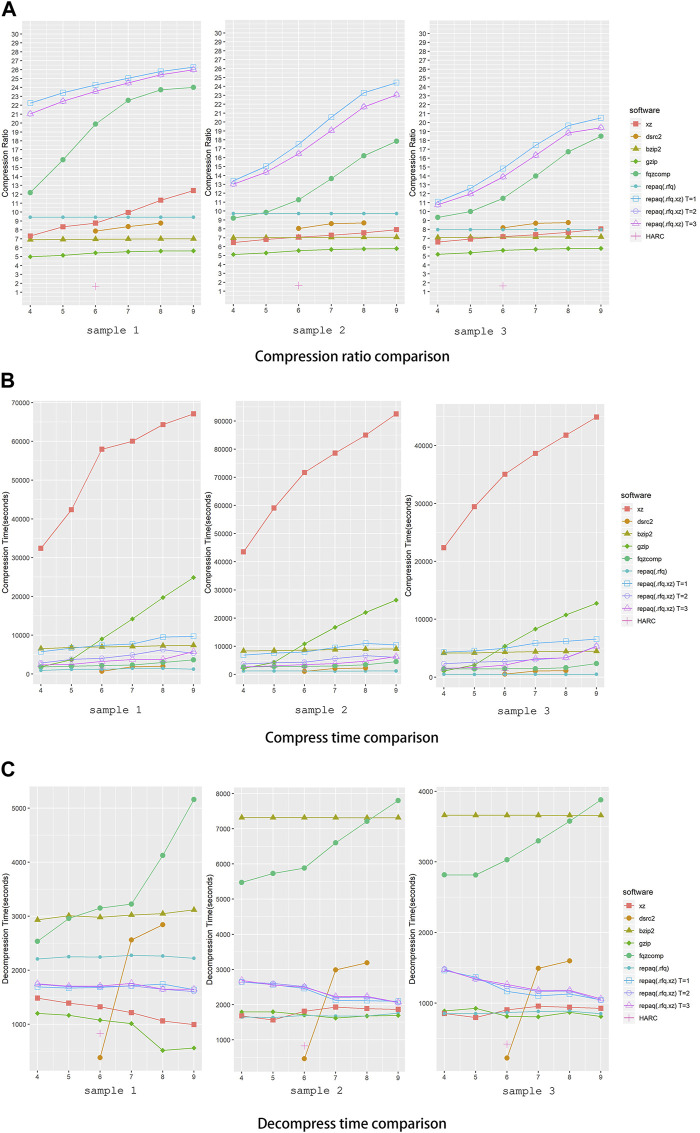
FIGURE 4.
Performance comparison of repaq and other tools. (A) Shows the comparison ratio of comparison, (B) shows the compress time of comparison, while (C) shows the comparison of time to decompress. Three samples were tested in this experiment. X-axis indicates compression level setting, while Y-axis indicates compression ratio. The DSRC2 has only three compression levels (0,1,2), so it is aligned to the middle compression level (6,7,8) in the figure. Sample 1 is a paired-end deep target cap-turing data (39 GB + 39 GB), while sample 2 is a paired-end whole exome sequencing data (46 GB + 46 GB) and sample 3 is a single-end whole exome sequencing data (46 GB). For repaq, both non-LZMA mode (.rfq) and LZMA mode (.rfq.xz) mode were tested. For LZMA mode repaq, different threading setting were applied (T = 1, 2, 3).

