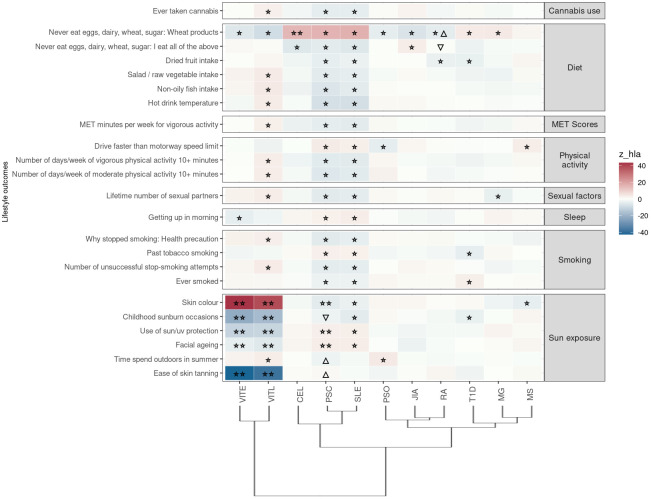
Figure 4.
Significant PRS-PheWAS for at least three AD PRS with phenotypes in the Lifestyle UK Biobank category, using the normalized PRS. The shown phenotypes were significantly associated, after FDR adjustment, with at least three AD PRS irrespectively of the HLA status. The colors of cells indicate the standardized effect sizes (β) for the regression between AD PRS with HLA and each phenotype. The one star “☆” shows the significant results only with the “HLA included” AD PRS. The two stars “☆☆” show the significant associations with both “HLA included or excluded” AD PRS with the same effect direction. The star and the upper facing triangle “☆▵” show the significant associations with both “HLA included or excluded” AD PRS but with opposite effect directions. The upper facing triangle “▵” shows the significant associations only with “HLA excluded” AD PRS that the effect direction is the same as the color indicates. To group the phenotypes, we used the categories provided by the UK Biobank. We used the hclust R function to perform the hierarchical clustering of the autoimmune disorders shown in the dendrogram using all standardized effect sizes for the Lifestyle category phenotypes.

