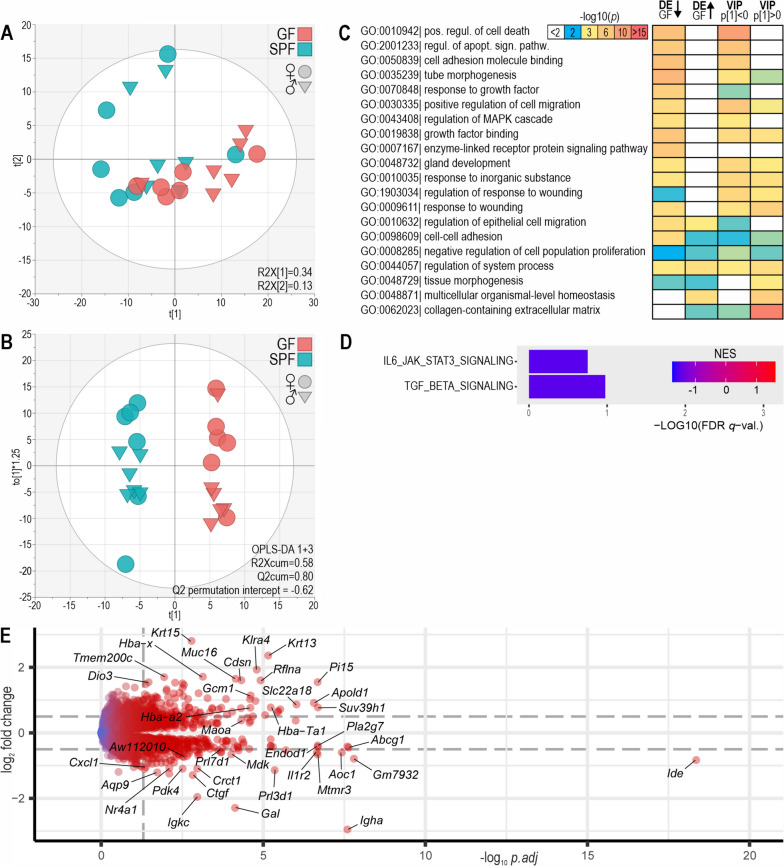
Fig. 4.
Differential gene expression analysis of GF versus SPF placenta. A PCA of 1000 most variable genes. The ellipsoid shows Hotelling’s T2 (95%). B OPLS-DA of 1000 most variable genes. C ORA of genes which were significantly upregulated or downregulated in GF versus SPF (p.adj < 0.05; DE GF up and DE GF down) and of genes with OPLS-DA variable importance in projection (VIP) > 1 and negative or positive S-plot loadings. The top 20 enriched ontology terms are shown; for more details, see Additional file 2: Figs. S1, S4. D Hallmark gene sets enriched in GSEA. The gene sets with FDR q-value < 25% are shown. E Volcano plot of differential gene expression. Genes with negative log2 fold change values were downregulated in the GF placenta. Dashed lines indicate log2 fold change ± 0.5 and adjusted p value 0.05

