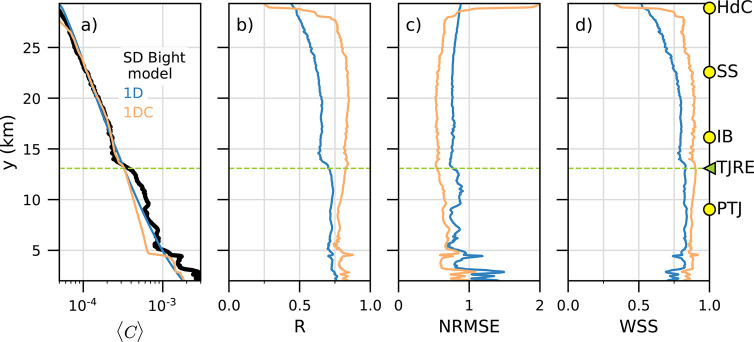
Figure 3.
1D (blue) and 1DC (orange) model performance during the model evaluation period as a function of y. (a) Time-averaged nearshore dye, 1D, and 1DC overlaid on the SD Bight model (solid black line). Performance metrics are (b) R, (c) NRMSE, and (d) WSS. Green dashed line is the location of TJRE. Beach locations marked on the RHS as in previous figures.

