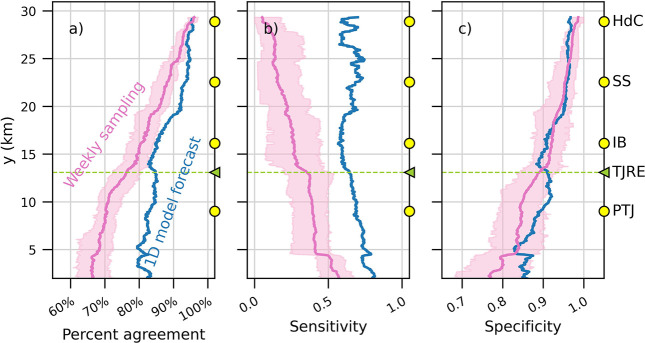
Figure 5.
(a) Percent agreement with ideal daily beach advisories (days when CC > CBAC for any hourly time step from Jan 1, 2018, to Dec 25, 2019) of simulated weekly sampling-informed daily beach advisories (pink) and 1D model-informed daily beach advisories (blue). Simulated weekly sampling was run for every possible sampling hour choice for weekly sampling. Pink line is the mean simulated weekly sampling-informed daily beach advisory accuracy, and pink shading fills from minimum to maximum accuracy. (b) Sensitivity and (c) Specificity of the 1D model forecast compared with simulated weekly sampling.

