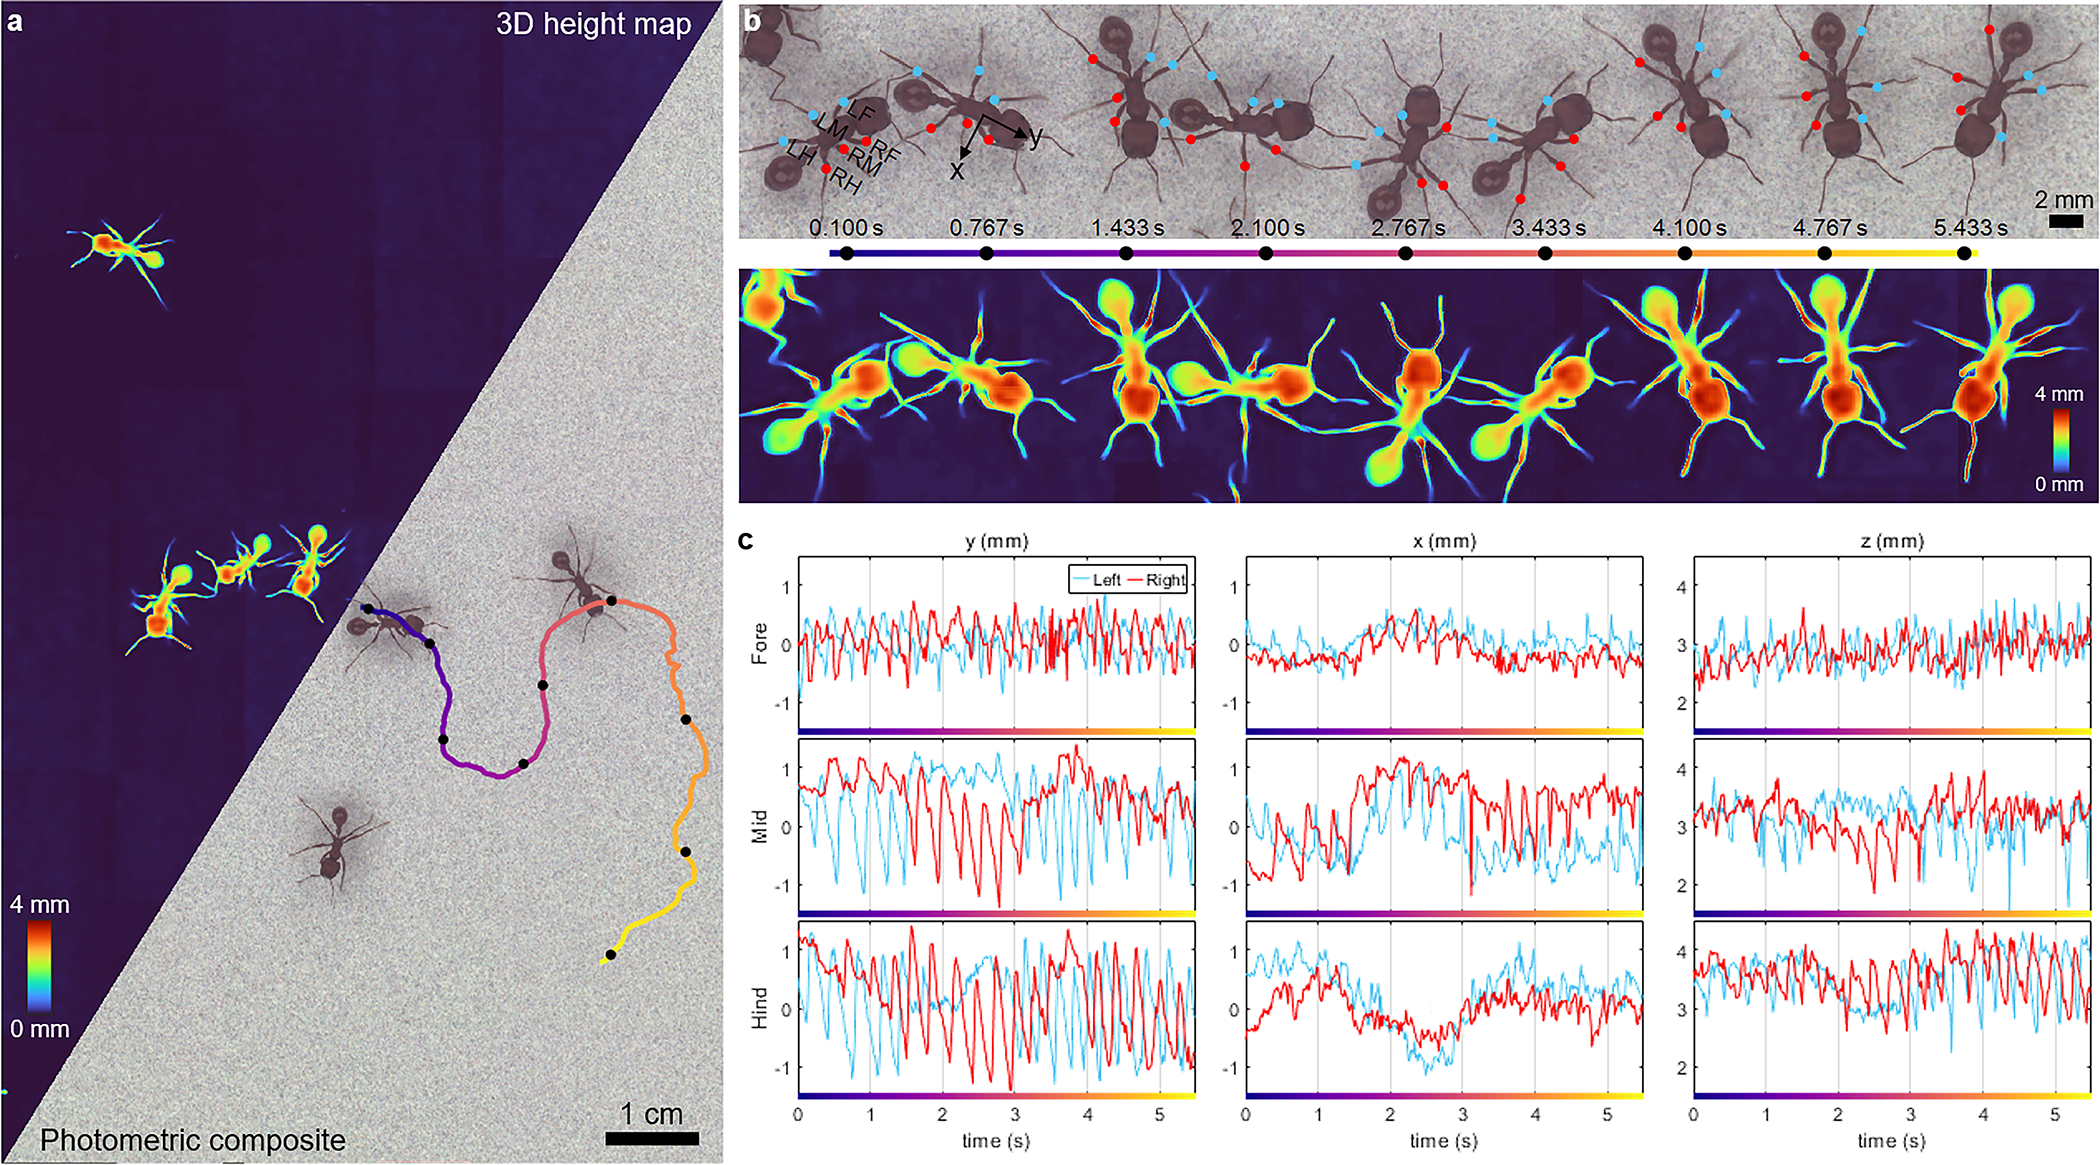
Fig. 5.

Harvester ants freely moving across a flat, noise-patterned surface, acquired at 60 fps for 10 sec (Supplementary Videos 11–12). a, Photometric composite and 3D height map of the zoomed-out FOV. One of the ants’ trajectories is color-coded by time, progressing from blue to red over a 5.5-sec duration, and is analyzed in b and c. b, Temporal snapshots of a single tracked ant along the trajectory in a. The blue and red dots are the femur-tibia joints for the ant’s 6 legs (L = left, R = right, F = foreleg, M = middle leg, H = hindleg). c, The 3D positions of the femur-tibia joints over the 5.5-sec trajectory. The lateral dimensions (xy) are defined relative to the ant’s orientation, as illustrated in b.
