
Extended Data Fig. 1.
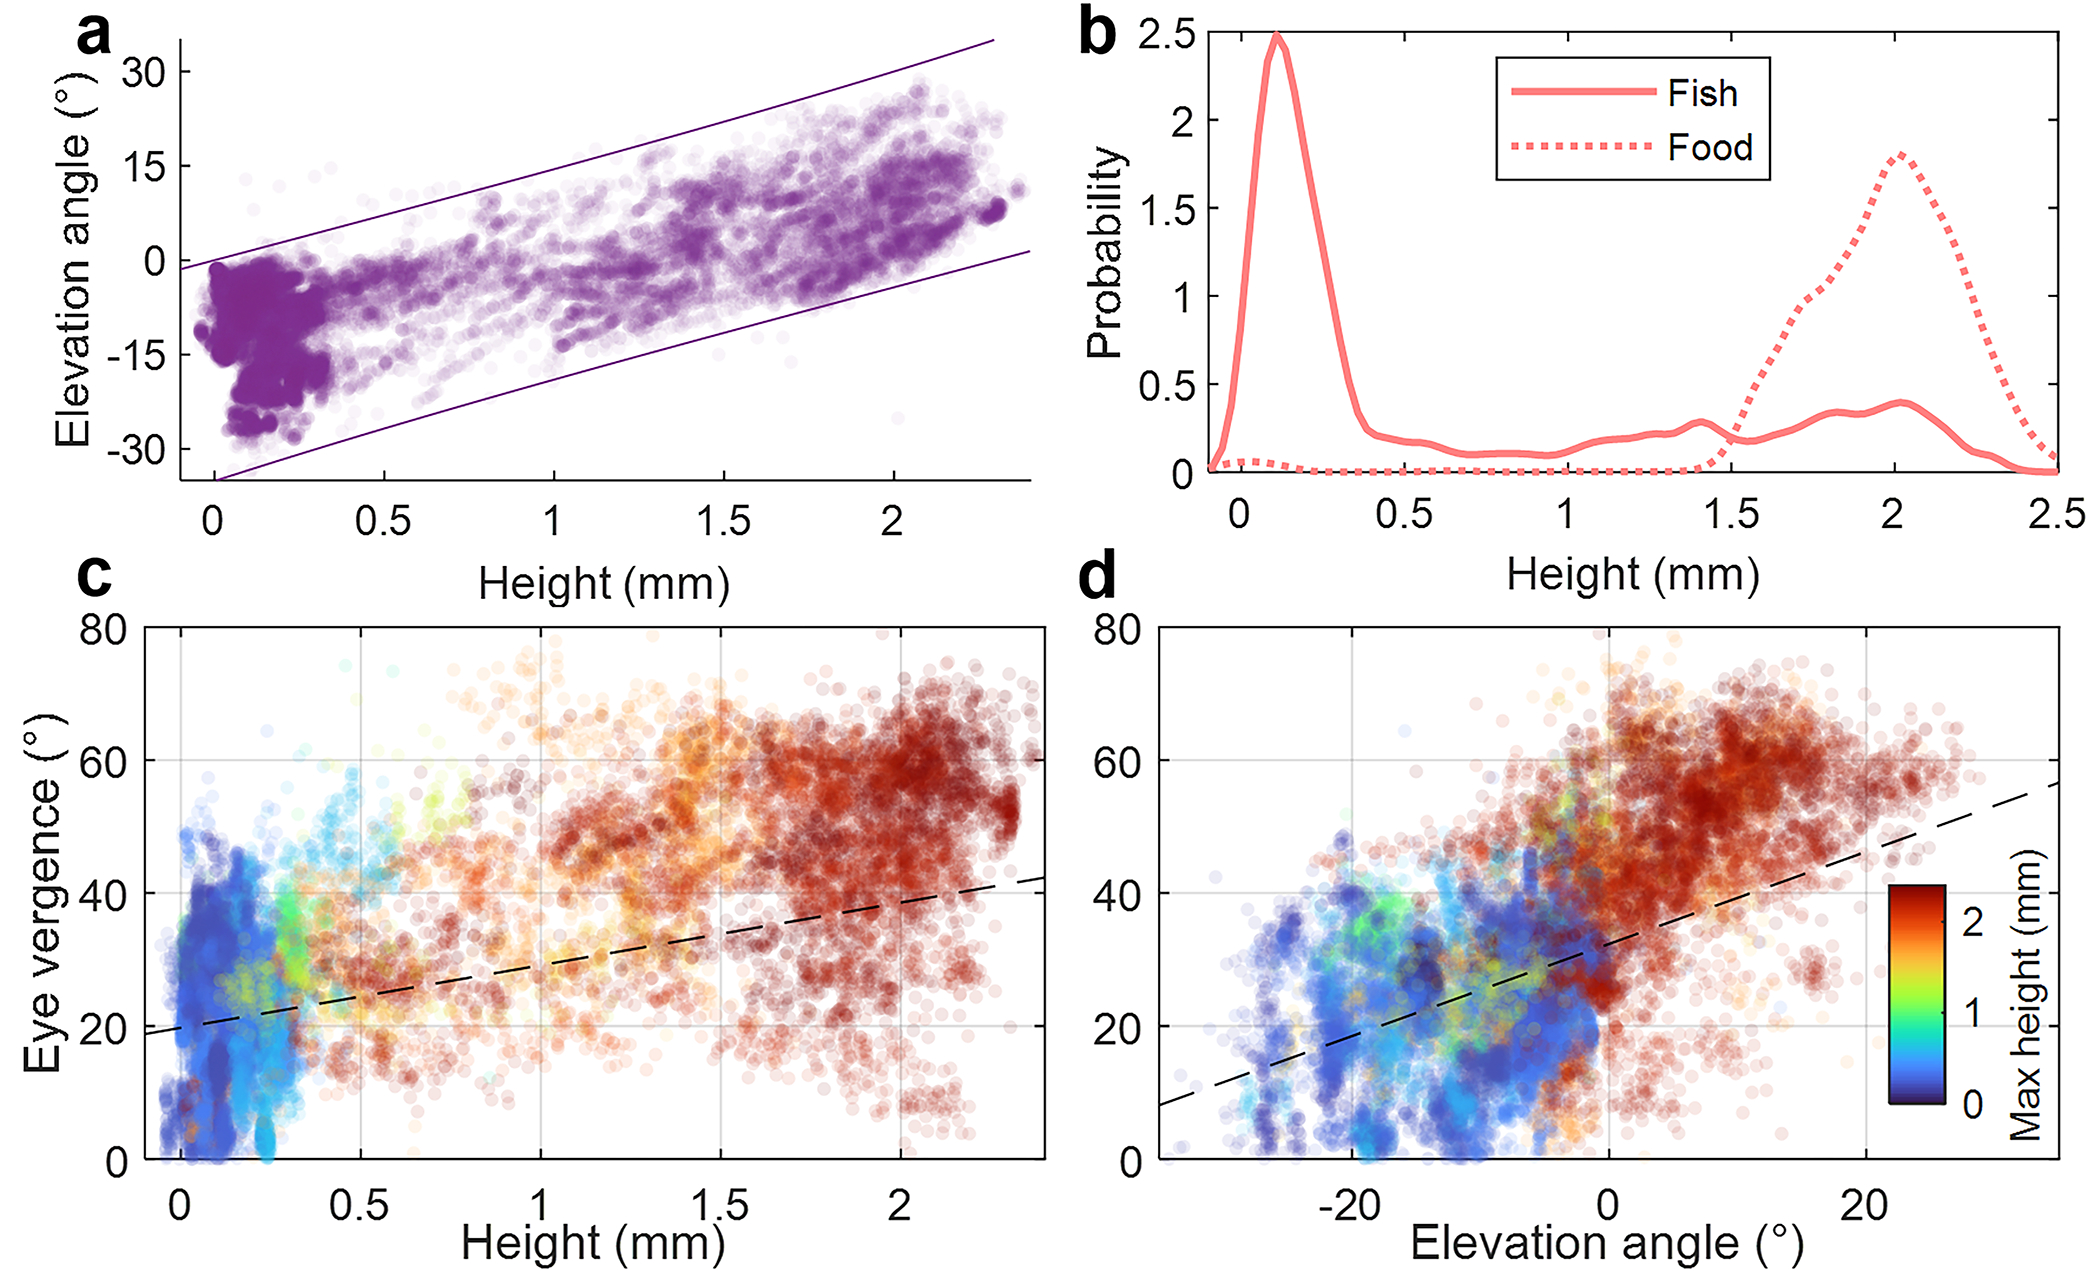
Population-level analysis of the zebrafish larvae featured in Fig. 3 and Supplementary Videos 1,3. a Fish head height vs. elevation angle for all 40 fish over time. Lines define the approximate physical limits due to geometric fish mobility constraints. b Kernel density estimates of the height distributions of the zebrafish and AP100 food particles. Eye vergence vs. head height (c) and vs. elevation angle (d) plots are color-coded by the maximum height the fish attained in the 10-sec video. Fixed effect components of the linear mixed-effects regression lines are plotted (p = 0.33 and p < 10−5) for c and d, respectively.