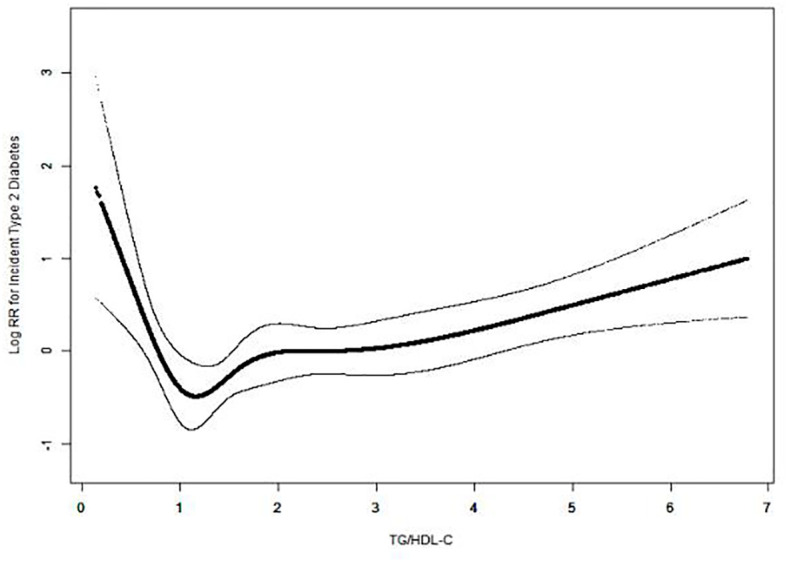
Figure 1.

U-shaped association between TG/HDL-C ratio and incident T2DM. A nonlinear association between TG/HDL-C ratio and incident T2DM was observed in a generalized additive model (GAM). The solid black line represents the smooth curve fit between the TG/HDL-C ratio and the incidence of diabetes. Dotted curves represent 95% CI of the fit. All were adjusted for age, fatty liver, body weight, waist circumference, BMI, total cholesterol, ALT, AST, GGT, systolic blood pressure, diastolic blood pressure, alcohol consumption, smoking status, and exercise habits.
