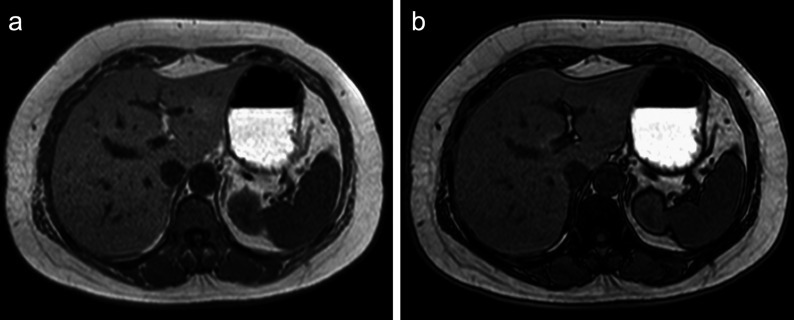
Fig. 1.
In the two-point Dixon method, in-phase and opposed-phase images can be obtained using the chemical-shift difference between water and fat protons. This is an example of a patient with nonalcoholic steatohepatitis. The signal intensity of the liver parenchyma decreases from the in-phase (a) to the opposed-phase image (b).

