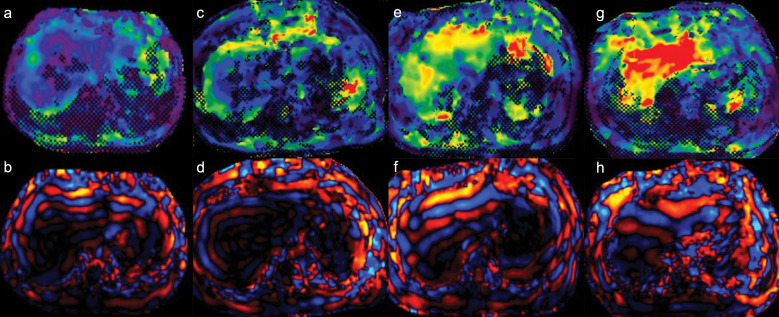
Fig. 4.
MR elastograms and wave images of four patients. The modulus of elasticity increased with the stage of fibrosis. The stiffness values of the liver were as follows: 2.43 kPa in the patient with F1 (biopsy specimen scored using New Inuyama Classification) (a and b), 2.97 kPa in F2 (c and d), 5.65 kPa in F3 (e and f), and 9.24 kPa in F4 (g and h).

