Figure 2.

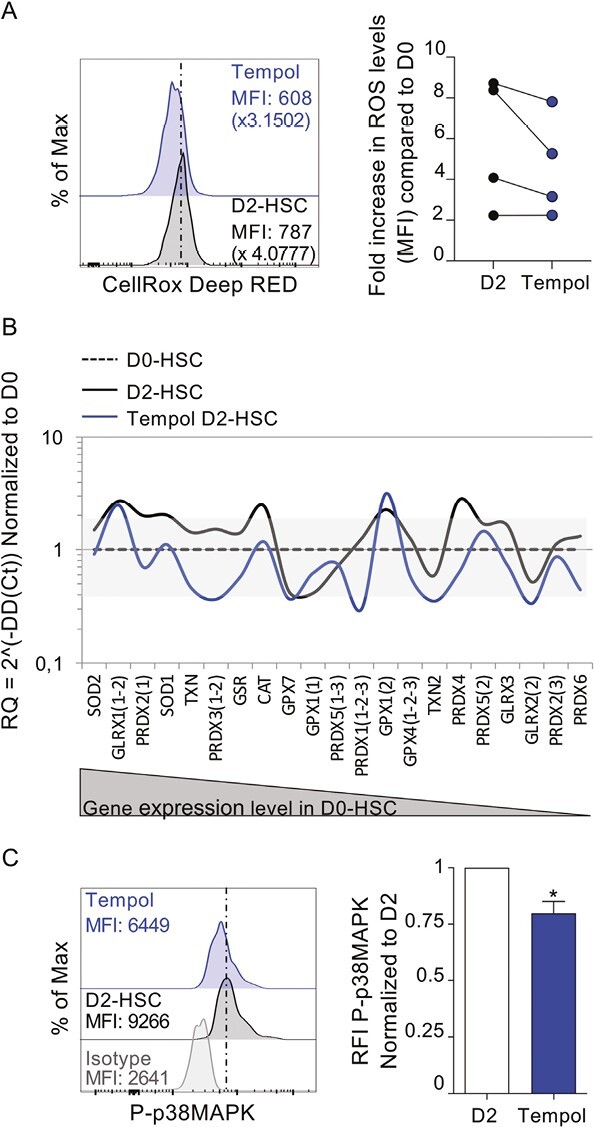
Tempol decreases ROS and oxidative stress response. (A) CD34+ cells were treated or not with Tempol, then ROS levels were measured using CellROX Deep red probe directedly after treatment (D0) or after 2 days of culture (D2). Left is represented ROS levels in HSC at D2 for one representative experiment, right the graft represents the fold increase in ROS levels compared to D0 HSC. Four independent experiments with 4 independent CB samples. (B) Antioxidogram is defined by the relative expression of 21 transcripts of key antioxidant genes by RT-qPCR in D2-HSC (black line) and Tempol treated-D2-HSC (blue line) compared to fresh cells (D0-HSC, dashed line). The grey zone corresponds to variations less than twice the normal expression. Transcripts are ranked in decreasing order of expression in D0-HSC. (C) Flow cytometry histograms (left) representing the level of phosphorylated p38MAPK (P-p38MAPK) in phenotypic D2-HSC. One representative example out of 4. Quantification (right) of MFI of P-p38MAPK relative to untreated condition. n = 4, Mann-Whitney test *P < .05.
