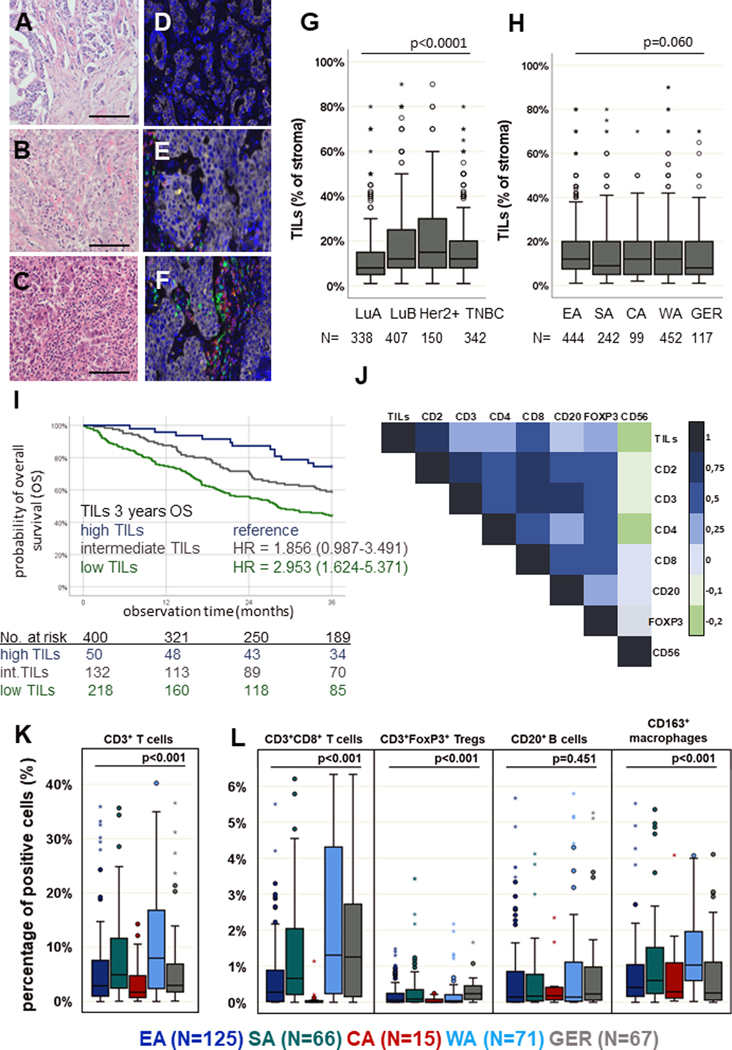
Figure 1: Tumor-infiltrating lymphocytes (TILs) and their quantitative distribution within the tumor microenvironment (TME) of BC samples.
Representative H&E staining of FFPE BC samples with low (A), intermediate (B) and high (C) infiltration of TILs. Scale bars depict 20 μm. In total, TILs were analyzed in 1,237 samples. MSI was performed on 374 samples with representatively shown pictures with low (D), intermediate (E) and high (F) infiltration of TILs. MSI allows visualization of immune cell subpopulations including CD3+CD8– T cells (yellow), CD3+CD8+ T cells (red), CD3+FOXP3+ T cells (turquoise), CD163+ macrophages (orange) and CD20+ B cells (green) as well as pan-cytokeratin+ cancer cells (grey). (G) Boxplots (line represents the mean) indicating that TILs were found to be higher in luminal-B-like (LuB), human epidermal growth factor receptor 2 positive (Her2+) and triple-negative BC (TNBC) subtypes, compared to luminal-A-like (LuA) (p < 0.0001, multivariate analysis). (H) No differences in the quantity of TILs in different regions in sub-Saharan Africa (SSA) were detected (Eastern Africa, EA; Southern Africa, SA; Central Africa, CA; Western Africa, WA), while the TIL frequency was tendentially lower in German (GER) BC samples. (I) Kaplan-Meier curve: the amounts of TILs indicates a prognostic impact with poorer survival in BC with lower numbers of TILs (p = 0.001, log-rank Test). (J) Pearson correlation map with association levels: a higher numbers of TILs are linked with increased frequencies of all immune cell subpopulations analysed. Pearson correlation coefficients are represented by different colours defined in the scale bar on the right side of the correlation map. The immune cell subpopulations analysed by MSI revealed higher numbers of CD3+ T cells (K), CD3+CD8+ T cells and CD163+ macrophages (M2) (L) in WA. No relevant difference in the frequency of CD20+ B cells was shown. However, in GER samples, the frequency of Tregs was slightly higher when compared to those in all regions of SSA. Except for the log-rank tests, all p-values were estimated in multivariate analyses and are adjusted for differences in age, grading, quality score, stage, IHC subtype and region of origin as confounding factors. All p-values are shown in the graphs.

