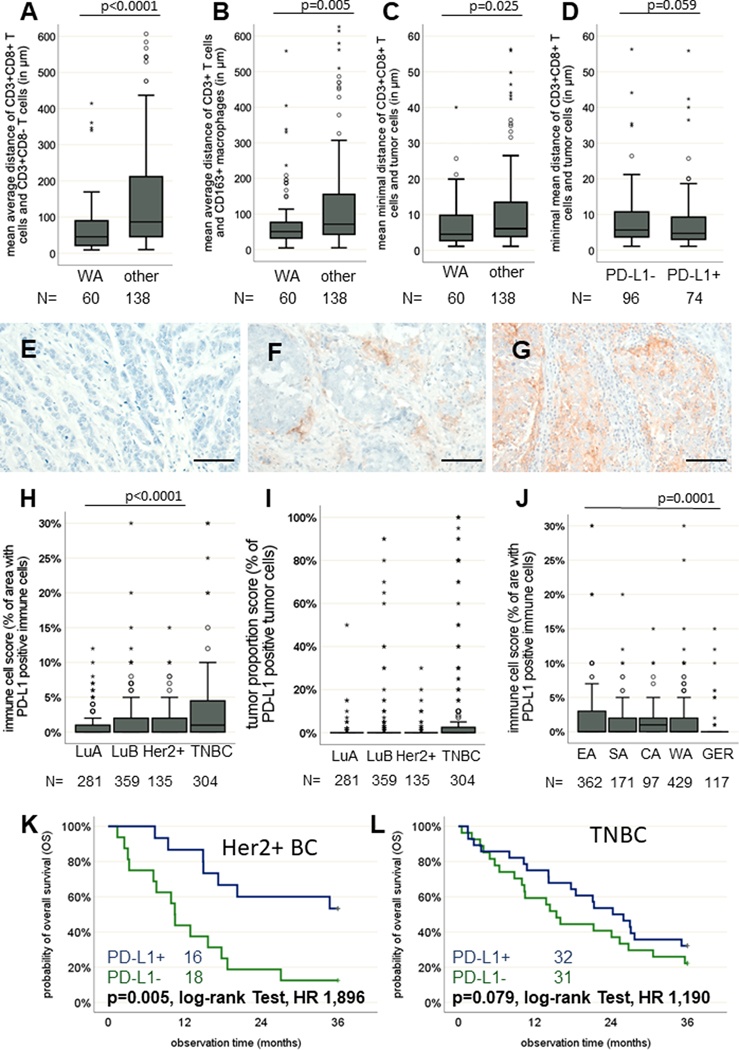
Figure 2: Spatial immune cell distribution in synopsis with PD-L1 expression in BC of SSA.
Boxplots (line represents the mean) showing that regardless of PD-L1 expression, a closer proximity of CD3+CD8− and CD3+CD8+ T cells is evident for Western SSA (WA) samples (A). A closer spatial proximity of CD3+ T cells and CD163+ macrophages exist in WA (B). Finally, a closer spatial proximity of CD3+CD8+ T cells and tumor cells was present in WA samples as well (C). Depending on the PD-L1 status, minor differences in the spatial proximity of CD3+CD8+ T cells and tumor cells could be shown, with a slightly higher proximity in PD-L1-positive samples (D). Representative IHC staining of BC samples without (E) and with low (F) and high (G) PD-L1 expression. Scale bars depict 50 μm. The prevalence of both BC samples positive for PD-L1, analysed with the immune cell score (H) and the tumor proportion score (I), was higher in triple-negative BC (TNBC). However, only minor differences were seen in the respective regions within SSA (J), while PD-L1 expression was significantly lower in GER samples. Kaplan-Meier curves show better OS of patients with PD-L1 BC in both (K) Her2+ and (L) TNBC subtypes. Except for the log-rank tests, all p-values were estimated in multivariate analyses and are adjusted for differences in age, grading, quality score, stage, IHC subtype and region of origin as confounding factors.

