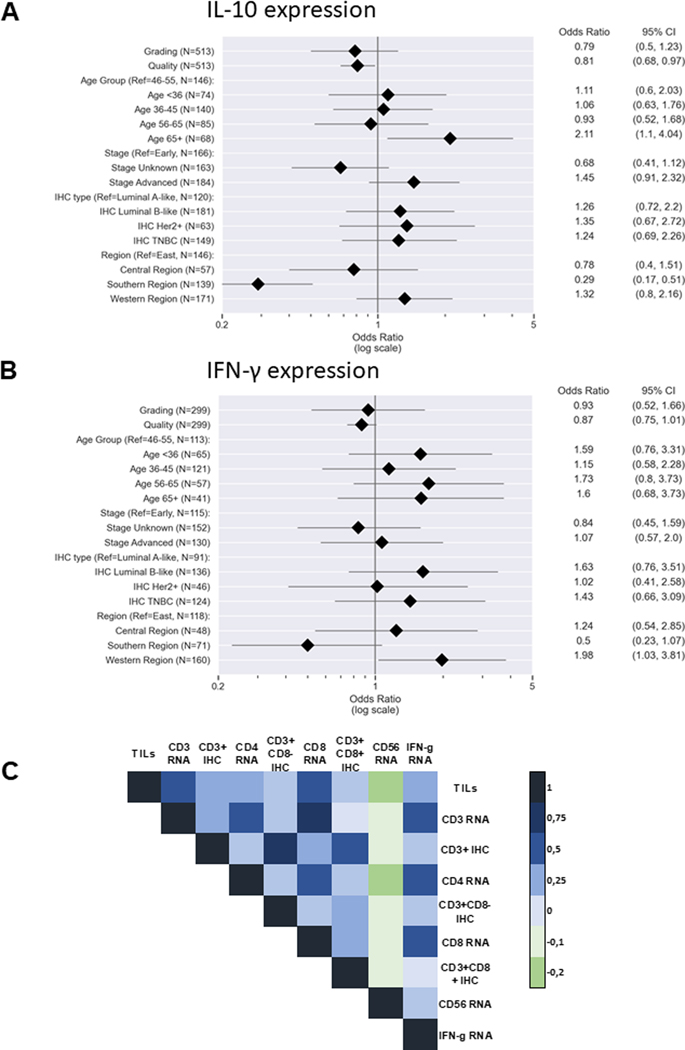
Figure 3: Cytokine expression and its influence on immune cell infiltration.
The expression of (A) interleukin (IL)-10 and (B) interferon-gamma (IFN-γ) is visualized with forest plots. Only samples with detectable RNA of the respective genes were considered. The different sample sizes correspond to the number of specimens for which data were available for all variables examined in each test. Pearson correlation map (C) showing the connection of IFN-γ expression and tumor-infiltrating lymphocytes (TILs) and immune cell subpopulations. Pearson correlation coefficient is displayed by different colours defined in the scale bar on the right-hand side of the figure.

