
Fig. 2.
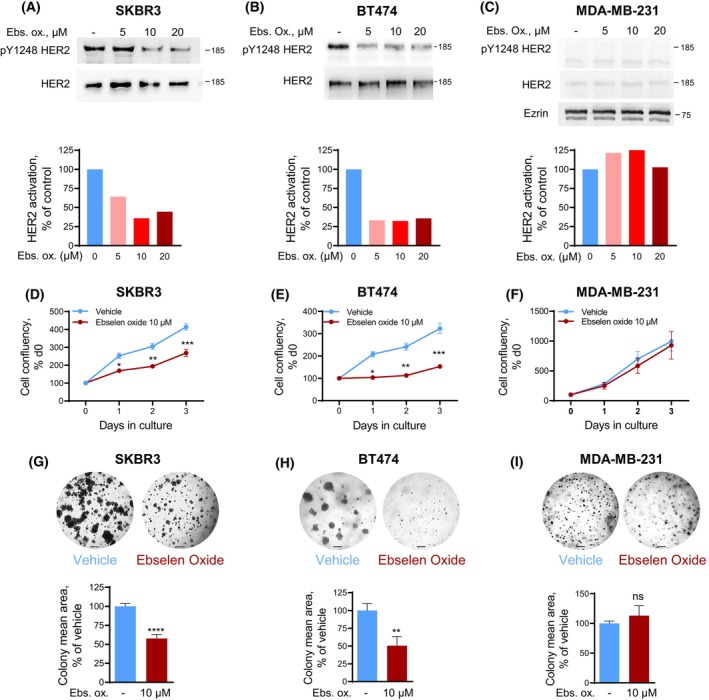
Ebselen oxide inhibits HER2 activation, cell proliferation, and anchorage‐independent growth of HER2+ breast cancer cells. (A–C) Lysates from HER2‐positive (SKBR3, A and BT474, B) or HER2‐negative (MDA‐MB‐231, C) breast cancer cells treated with ebselen oxide (0–20 μm) were analyzed by western blot using antibodies against pY1248 HER2, HER2 and ezrin and the optical density was quantified. Blot and quantification of a representative experiment are shown out of 4 (A), 5 (B), or 2 (C) independent experiments. (D–F) Proliferation curves of HER2‐positive (SKBR3, D or BT474, E) or HER2‐negative (MDA‐MB‐231, F) breast cancer cell lines treated with vehicle or 10 μm ebselen oxide assessed by MTT assay. A representative experiment is shown out of 5 (D), 4 (E), or 4 (F) independent experiments where data are mean ± SEM; 2‐way ANOVA (mixed‐effect analysis) followed by Bonferroni's multiple comparison test, *P < 0.05, **P < 0.01, ***P < 0.001. (G–I) Anchorage‐independent growth of SKBR3 (G), BT474 (H), or MDA‐MB‐231 (I) cells treated with vehicle or 10 μm ebselen oxide. Representative images and quantification of the colony mean area are shown where data are mean ± SEM (n = 2), unpaired t test, ****P < 0.0001 (n = 4–12) (G); (n = 2), unpaired t test, **P < 0.01 (n = 6–9 replicates) (H); (n = 2), unpaired t test, ns P = 0.4325 (n = 6–7 replicates) (I). Scale bars are 200 μm.