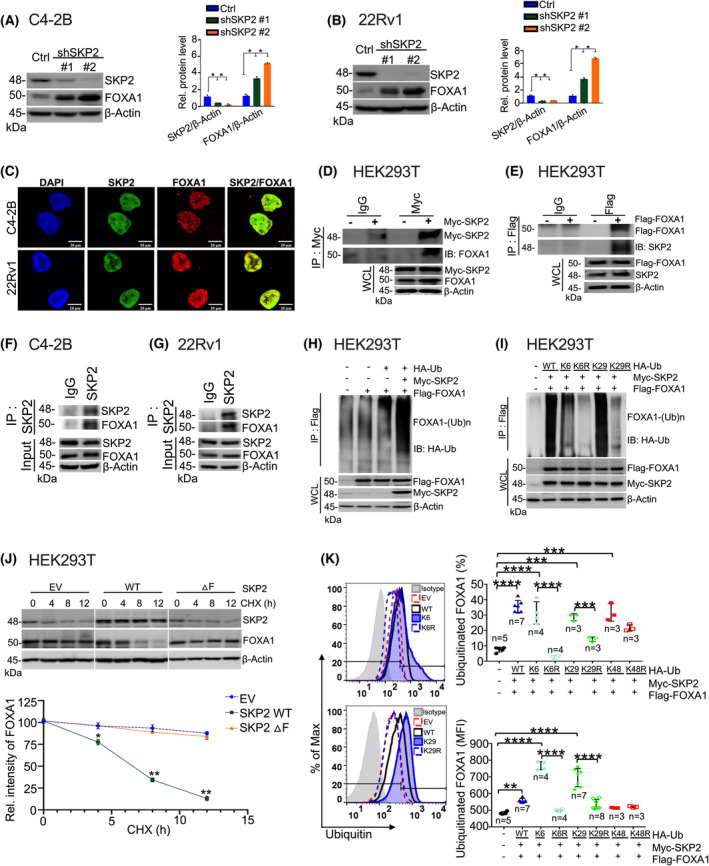
Fig. 2.

SKP2 regulates FOXA1 through K6 and K29‐linked ubiquitination. (A, B) Immunoblot analysis displays FOXA1 elevation in C4‐2B (n = 3) and 22Rv1 (n = 3) cells upon SKP2 knockdown (KD) via shRNA. Quantification analysis of the relative protein levels for SKP2 and FOXA1 is displayed on the right. (C) Immunofluorescence (IF) images demonstrate the colocalization of endogenous SKP2 and FOXA1 proteins in C4‐2B and 22Rv1 PCa cells. Scale bars are 20 μm. (D, E) Co‐immunoprecipitation analysis displays a physical interaction for SKP2 and FOXA1 proteins in HEK293T (n = 3) cells using Myc‐tagged SKP2 or Flag‐tagged FOXA1. WCL indicates the whole cell lysates. (F, G) Immunoprecipitation analysis displays an interaction for endogenous SKP2 and FOXA1 proteins in C4‐2B (n = 3) and 22Rv1 (n = 3) PCa cells. (H) In vivo ubiquitination assay displays an increase in HA‐Ub‐linked ubiquitination for FOXA1 by Myc‐SKP2 in HEK293T (n = 3) cells. (I) In vivo ubiquitination assay demonstrates a reduction in ubiquitination for K6R and K29R mutants (n = 3). (J) HEK293T cells were co‐transfected with Flag‐tagged FOXA1, HA‐ubiquitin (wild type, WT), and WT‐Myc‐SKP2 or a ▵F SKP2 mutant before being treated with Cycloheximide (CHX; 100 μg·mL−1) protein synthesis inhibitor for the indicated time points (h, hours). EV refers to empty vector. Lower panel is the corresponding plot for FOXA1 protein intensity (n = 3). (K) The percent and mean fluorescence intensity (MFI) of FOXA1 ubiquitination in HEK293T cells after overexpression of Myc‐SKP2, Flag‐FOXA1, and HA‐Ubiquitin WT or mutants. Colored points represent number of replicates per group. Comparisons between groups were analyzed using paired two‐tailed Student's t‐test. Bars indicate SEM. *P < 0.05, **P < 0.01, ***P < 0.001, ****P < 0.0001.
