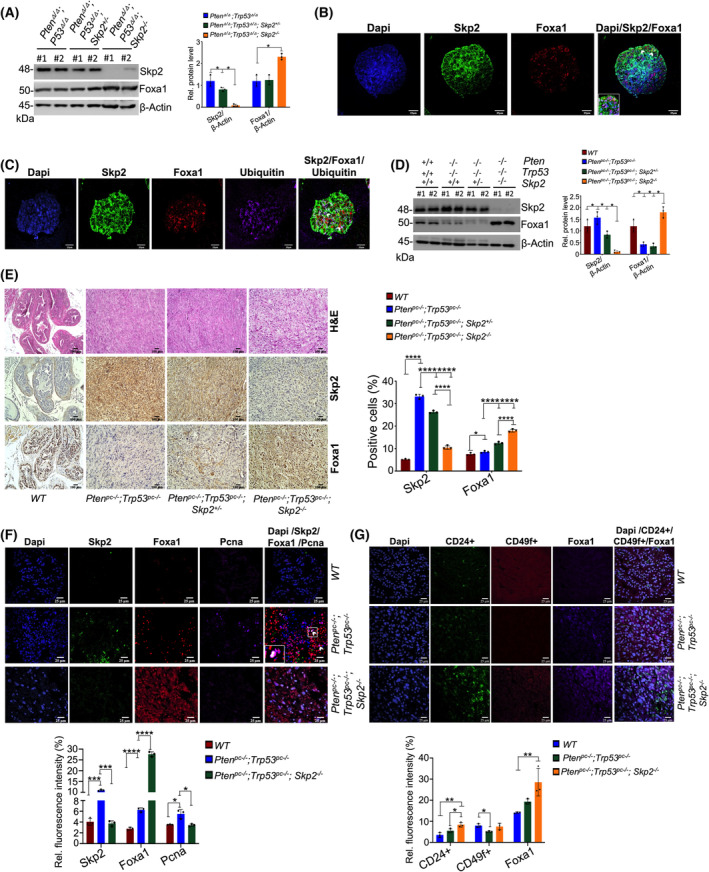
Fig. 3.

Skp2 Abrogation elevates Foxa1 levels in vivo in mouse models. (A) Immunoblot analysis shows the effects of Skp2 on Foxa1 protein levels in mouse embryonic fibroblasts (MEFs) with indicated genotypes. Quantification of protein levels is relative to beta‐Actin and displayed in the right panel (n = 3). (B, C) Immunofluorescence (IF) images show colocalization among Skp2, Foxa1, and ubiquitin in murine prostate organoids (n = 3). White arrows indicate colocalization for Skp2, Foxa1, and Ubiquitin. Scale bars are 25 μm. (D) Western blotting analysis of Skp2 and Foxa1 protein levels for anterior prostate (AP) tissues of mice with the indicated genotypes. Quantification analysis for the corresponding protein expression is shown in the right panel (n = 3). (E) Immunohistochemistry (IHC) staining of Skp2 and Foxa1 in prostate tissues of mice with the indicated genotypes. The side panel displays a quantification analysis for IHC staining (n = 3). Scale bars are 100 μm. (F) IF images show colocalization (white arrows) among Skp2, Foxa1, and Pcna (proliferating cell nuclear antigen) prostate tissues in Pten pc−/− ; Trp53 pc−/− mutant mice, while Skp2 loss in Pten pc−/− ; Trp53 pc−/− ; Skp2 −/− mutant mice has decreased Skp2, Foxa1, and Pcna colocalization (n = 3). Scale bars are 25 μm. (G) IF images for luminal (CD24+) and basal (CD49f+) lineage markers in Pten pc−/− ; Trp53 pc−/− and Pten pc−/− ; Trp53 pc−/− ; Skp2 −/− mutant mice (n = 3). Scale bars are 25 μm. Comparison between groups was performed using Student's t‐test. Bars indicate SEM. *P < 0.05, **P < 0.01, ***P < 0.001, ****P < 0.0001.
