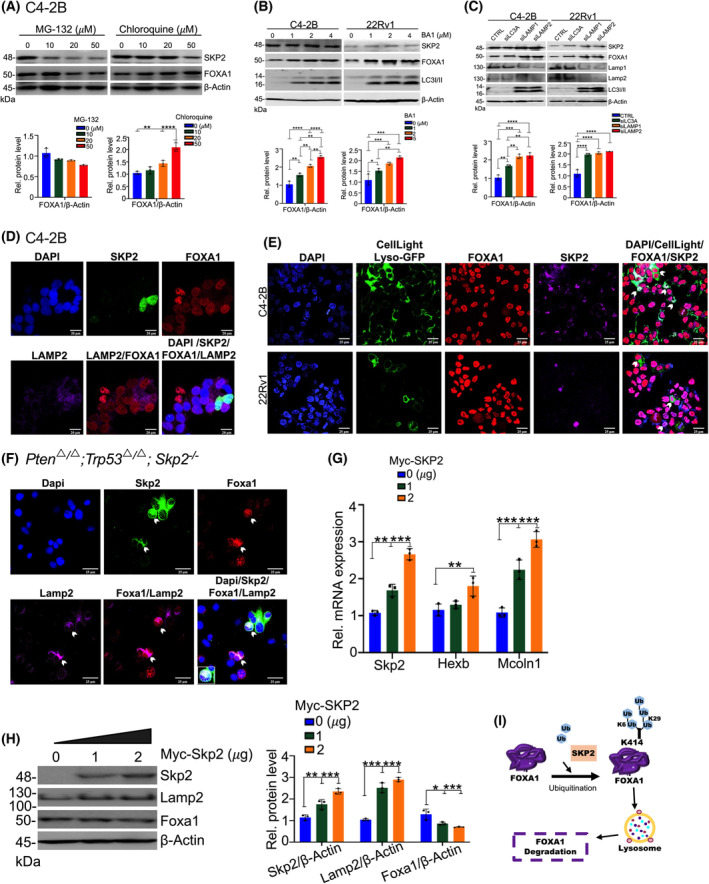
Fig. 5.

FOXA1 Regulation by SKP2 is a lysosomal‐dependent event. (A) The effects of Chloroquine on FOXA1 levels in C4‐2B cells. Cells were subjected to MG132 or chloroquine treatment at the indicated concentrations (μm). Lower panels display the quantification for FOXA1 protein levels (n = 3). (B) The effects of bafilomycin A1 (BA1) treatment at the indicated concentrations (μm) on FOXA1 protein levels in C4‐2B and 22Rv1 cells. Quantification for FOXA1 levels is displayed below (n = 3). (C) Immunoblot demonstrating the effects of lysosomal marker (LC3, LAMP1, and LAMP2) KD on FOXA1 protein levels in C4‐2B and 22Rv1 cells. Lower panels demonstrate quantified FOXA1 protein levels (n = 3). (D) Immunofluorescence (IF) images display an increase in LAMP2 (lysosome‐associated membrane glycoprotein) levels in C4‐2B cells upon Myc‐SKP2 overexpression (n = 3). Scale bars are 20 μm. (E) CellLight Lysosome‐GFP, BacMam 2.0, labeling of lysosomal activity in association with FOXA1 in C4‐2B (n = 3) and 22Rv1 (n = 3). White arrows indicate colocalization between the lysosome and FOXA1. Scale bars are 25 μm. (F) IF images show the impact of Skp2 restoration on Lamp2 in Pten/Trp53/Skp2 triple‐null mouse embryonic fibroblasts (MEFs) proceeding transient overexpression of Myc‐SKP2 (n = 3). White arrows indicate colocalization amongst Lamp2, FOXA1, and Skp2. Scale bars are 25 μm. (G) qRT‐PCR analysis of Skp2 and the lysosomal genes Hexb and Mcoln1 in Pten/Trp53/Skp2 triple‐null MEFs proceeding the transient overexpression of Myc‐SKP2 or an empty vector (EV). Results represent relative expression values to the housekeeping gene beta‐Actin (n = 3). (H) Western blotting analysis of Skp2, FOXA1, and Lamp2 levels for Pten/Trp53/Skp2 triple‐null MEFs proceeding overexpression of Myc‐SKP2 (0–2 μg). Quantification analysis for the corresponding relative protein levels is shown in the right panel (n = 3). (I) A working model on the K6‐ and K29‐linked ubiquitination of FOXA1 by SKP2 in lysosomal degradation. Comparison between groups was performed using Student's t‐test. Bars indicate SEM. *P < 0.05, **P < 0.01, ***P < 0.001, ****P < 0.0001.
