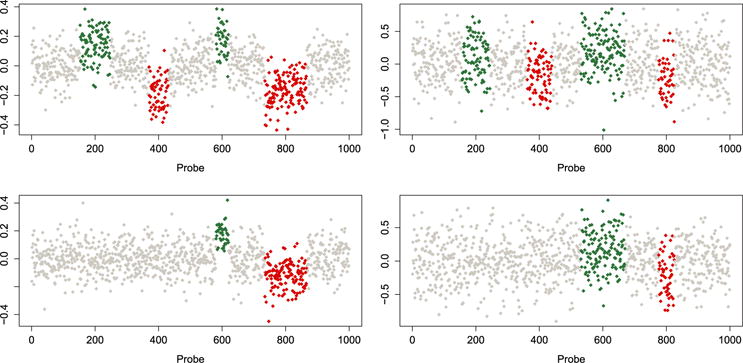
Figure 2.

Simulated aCGH data. No copy number alterations (white dots), amplifications (green/medium grey dots) and deletions (red/dark grey dots). Group 1 (top row) and group 2 (bottom row). Low noise level (left column) and high noise level (right column).
