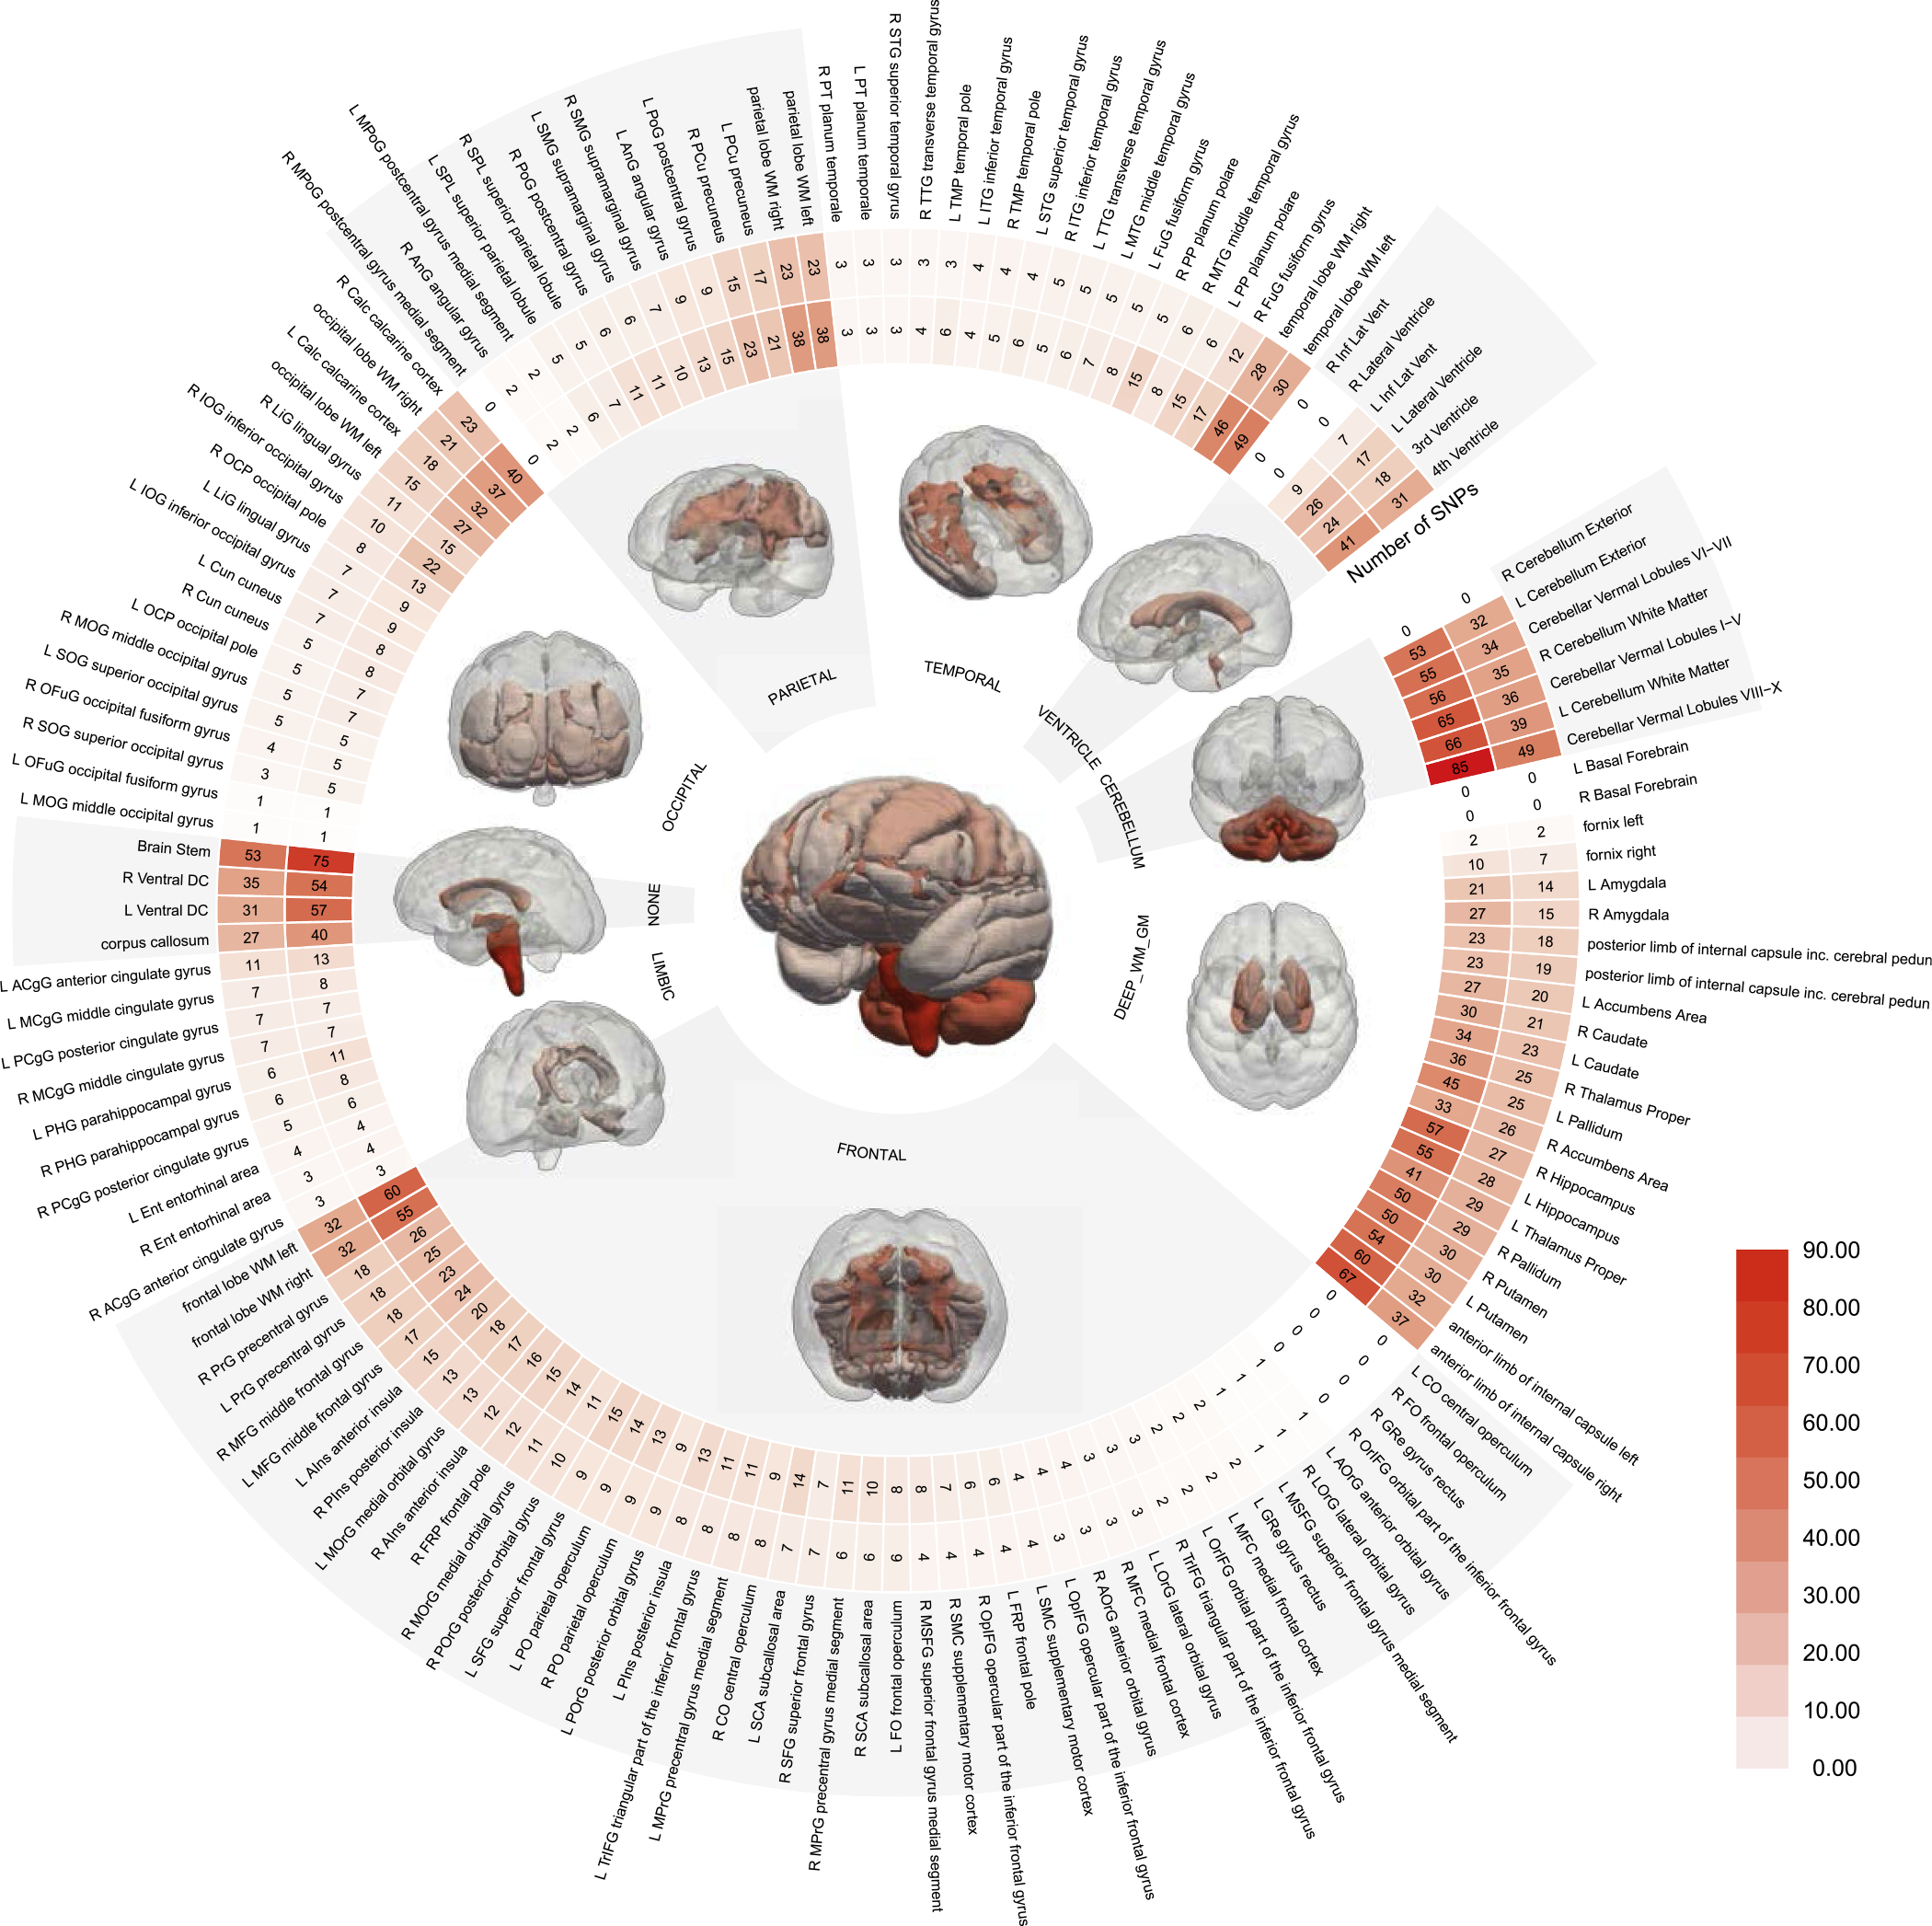
Fig. 2.

Genome-wide association study (GWAS) between brain volumes and single nucleotide polymorphisms (SNPs). Human brain volumes are highly polygenic, in particular, the cerebellum and brain stem. The circular plot shows the number of independent significant SNPs (the inner circle) and leading SNP counts (the outer circle) (Supplementary eMethod 4), respectively. The statistical brain maps present the number of lead SNPs per anatomical region (e.g., frontal cortex) and the entire brain (i.e., the central figure). Refer to Supplementary eTable 1 for details. WM: white matter; GM: gray matter.
