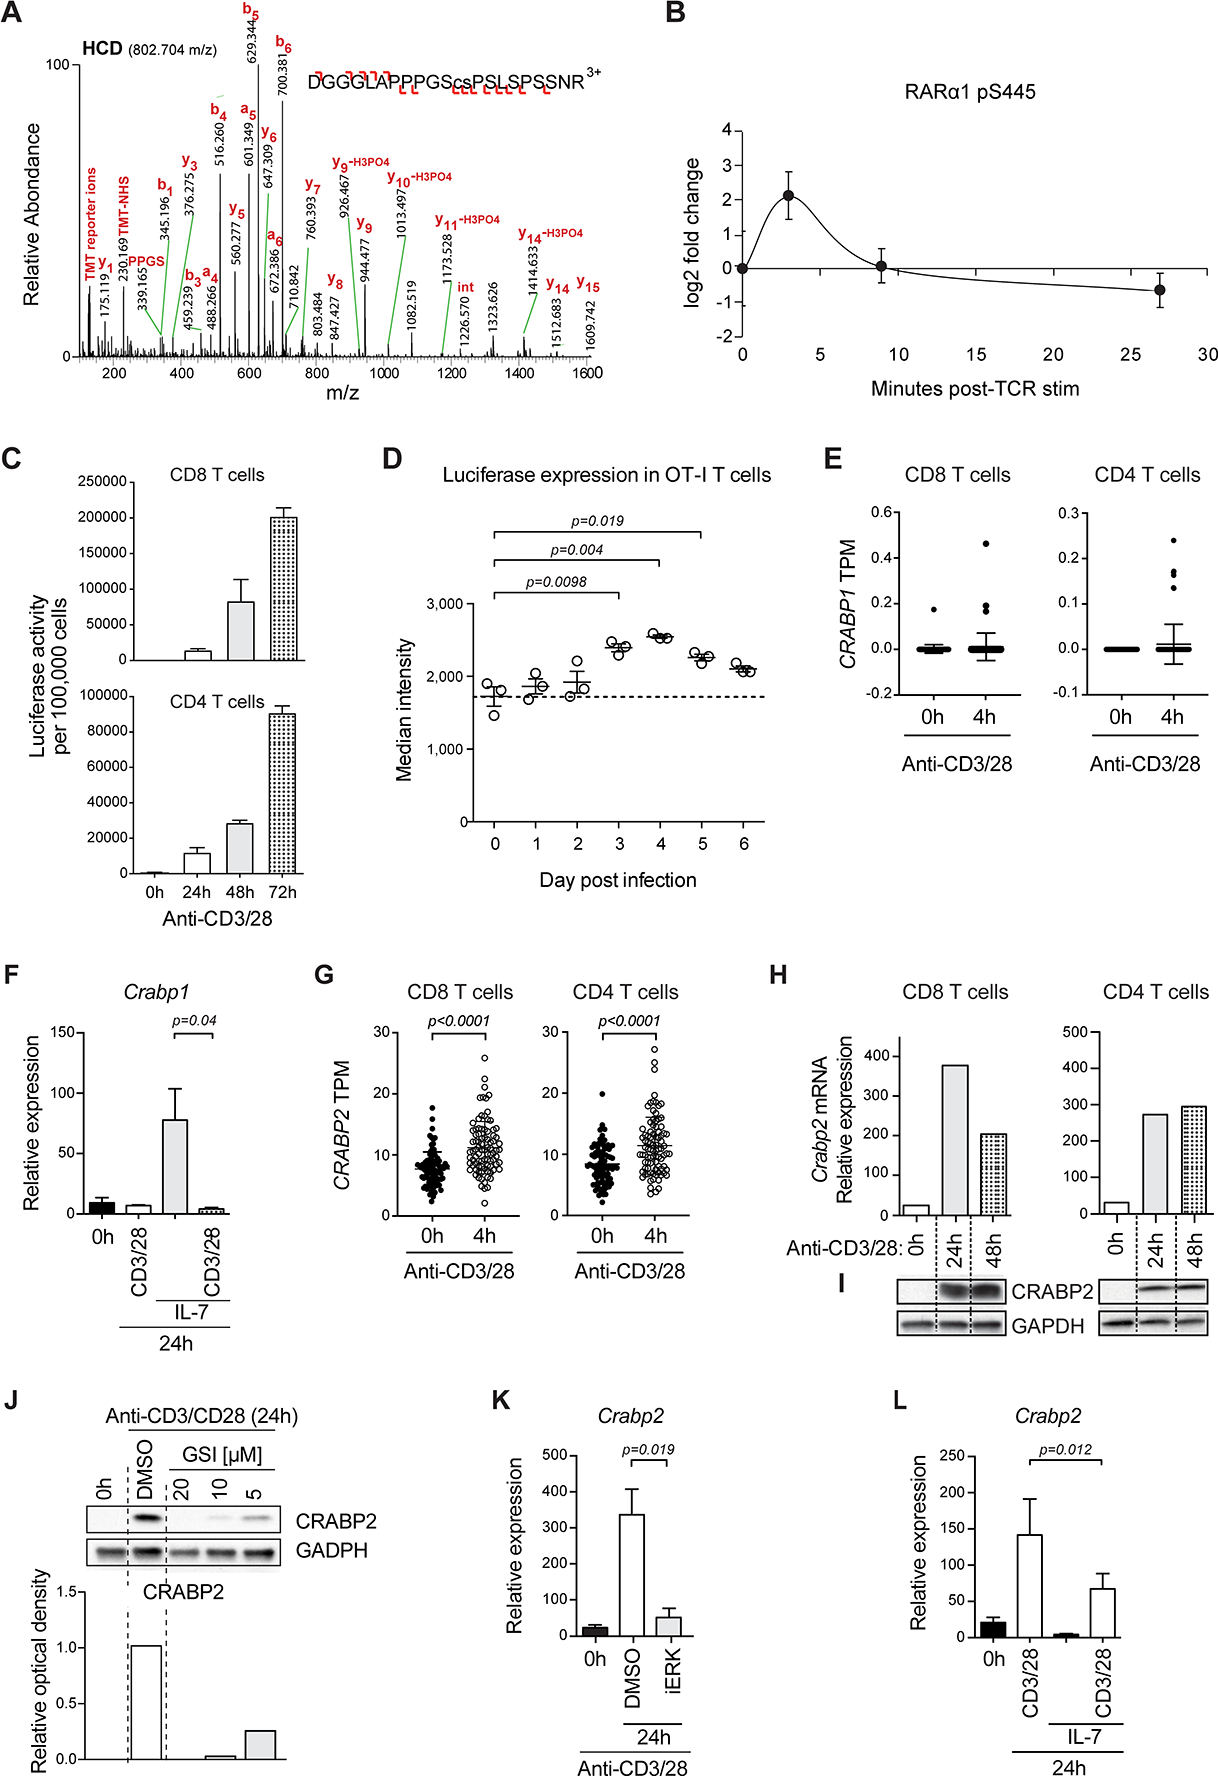
FIGURE 4: Extranuclear and nuclear RARα are activated by distinct mechanisms.

(A) Higher-energy C-trap dissociation (HCD) MS2 mass spectrum identifying TCR-induced phosphorylation of RARα at S445. Sequence of a 22 amino acid F domain peptide with phosphorylated serine is in lower case. Difference between measured and theoretical m/z expressed as parts per million (ppm). Product ions leading to the peptide sequence are shown, with b- (N-terminal) and y-series (C-terminal) ions indicated with left and right facing signs. (B) Phosphorylation dynamics of RARα pS445 in the first 30min of T cell stimulation, relative to unstimulated, determined by tandem mass tag (TMT)-based quantification. Error bars show standard deviation for double or triple biological replicates. (C) RARE-Luc CD8 or CD4 T cells activated with α-CD3/CD28 for 24hrs, 48hrs and 72hrs. Luciferase activity was measured. The means +/− SEM of 2 experiments are shown. (D) Three OT-I TCR transgenic RARE-Luc mice infected i.v. with ActA− Lm-OVA/day analyzed until 6 days post-infection for luciferase expression in spleen cells. Median fluorescence intensity of luciferase expression per mouse is shown. Data are from 1 experiment out of 2. (E) RNA-Seq data from human naïve CD8 or CD4 (CD3+ CD45RA+ CD127+ CCR7+) peripheral blood T cells stimulated with α-CD3/CD28 for 4hrs analyzed for CRABP1 expression. CRABP1 mRNA in transcripts per million (TPM) for each donor (n=88). P value calculated by Mann-Whitney U test. Datasets are from Database of Immune Cell Expression, expression quantitative trait loci (eQTLs) and epigenomics (DICE); https://dice-database.org/. (F) Mouse spleen CD8 T cells activated with α-CD3/CD28 or IL-7 or both. Crabp1 mRNA was quantified. Data are means +/− SEM of 4 experiments. (G) Expression of CRABP2 mRNA in activated human T cells assessed as in (E). (H-I) CD8 or CD4 mouse spleen T cells activated with α-CD3/CD28 and Crabp2 mRNA (H) and protein (I) were evaluated. Relative expression (mRNA) or western blot (Protein) of 1 of 3 experiments. (J) Expression of CRABP2 in CD4 mouse spleen T cells activated for 24hrs with α-CD3/CD28 alone or together with various doses of γ-secretase inhibitor (GSI). Quantification of the optical band density relative to control HSP90. Representative western blot of two independent experiments. (K) Spleen T cells activated with α-CD3/CD28 for 24hrs in DMSO or with MEK/ERK inhibitor U0126 (iERK). Crabp2 mRNA was evaluated. Means +/− SEM of Crabp2 mRNA are shown of 3 experiments. (L) Mouse spleen T cells activated with α-CD3/CD28 or IL-7 or both. mRNA of Crabp2 was quantified. Data are means +/− SEM of 4 experiments.
