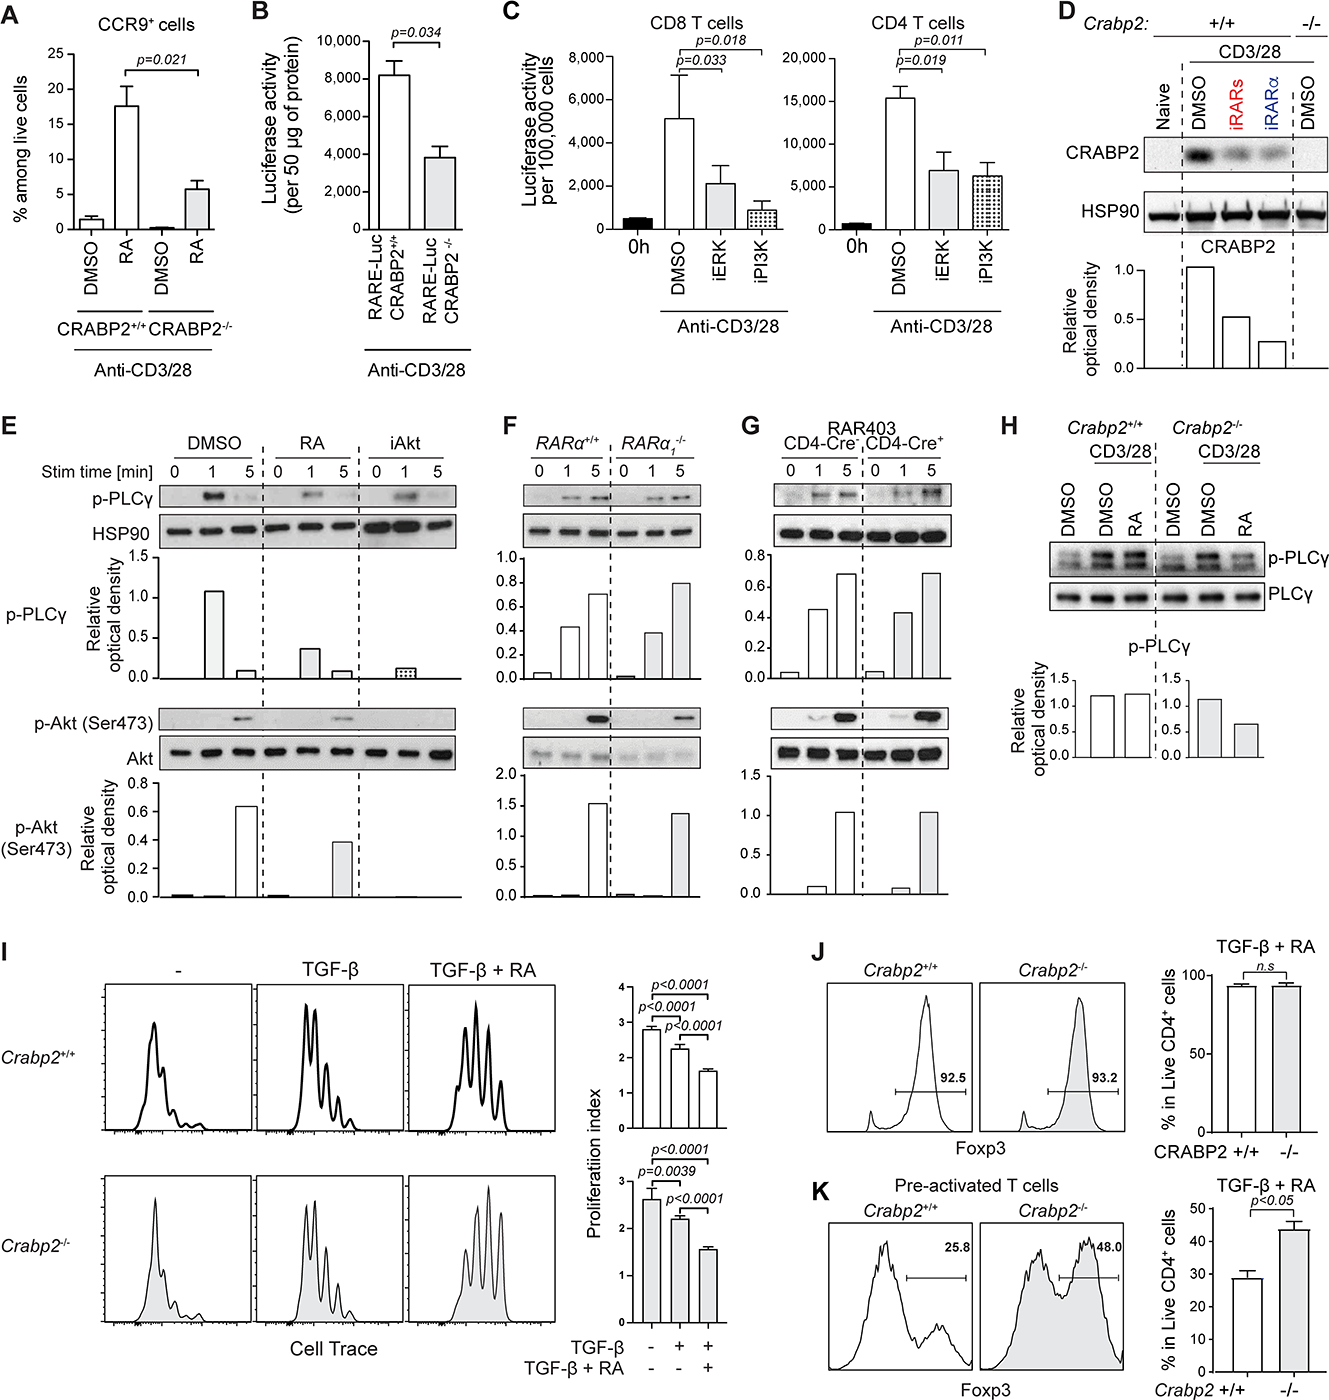
FIGURE 5: RA counteracts extranuclear RARα signaling in T cells. (Related data shown in Figure S4).

(A) WT or CRABP2-deficient spleen T cells activated with α-CD3/CD28 and RA for 72hrs and assessed for CCR9 expression. Graphs show means +/− SEM of CCR9+ T cells from 3 experiments. (B) WT- or CRABP2-deficient-RARE-Luc spleen T cells activated with α-CD3/CD28 for 48hrs and assessed for luciferase activity. Shown are means +/− SEM of luciferase activity per 50μg of protein for 3 experiments. (C) RARE-Luc CD8 (left) or CD4 (right) T cells activated with α-CD3/CD28 for 24hrs in DMSO, or a MEK/ERK inhibitor U0126 (iERK) or a PI3K inhibitor LY294002 (iPI3K). Luciferase activity was measured. Data are shown as means +/− SEM of 3 experiments. (D) WT or CRABP2-deficient spleen T cells activated with α-CD3/CD28 for 24hrs in DMSO and for WT T cells also with pan-RAR antagonist (iRARs) or RARα antagonist (iRARα). CRABP2 expression is evaluated. Representative western blot of 2 independent experiments. (E) Naïve CD4 T cells in DMSO, Retinoic Acid (RA) or an AKT inhibitor (AKT Inhibitor VIII) and activated with α-CD3/CD28 for indicated times. Phosphorylation of PLCγ and AKT was assessed. (F-G) Naïve CD4 T cells from nRARα-deficient (F) or DNRARα mice (G), activated with α-CD3/CD28 for indicated times were assessed for phosphorylation of PLCγ and AKT. (H) WT or CRABP2-deficient spleen T cells activated with α-CD3/CD28 for 72hrs were sorted and re-activated for 1min in DMSO or DMSO + (10nM) RA and PLCγ phosphorylation evaluated. Total PLCγ was measured as control. Data in (E-H) are representative from 3 experiments. (I) Proliferation of cell trace-labeled WT or CRABP2-deficient CD4 T cells activated with α-CD3/CD28 alone or with TGF-β or TGF-β + RA for 72hrs was evaluated. Histograms show a representative experiment and graphs show means +/− SEM of the division index from 3 experiments, expressed as a percentage of control. (J) Naïve WT or CRABP2-deficient CD4 T cells activated with α-CD3/CD28 alone or with TGF-β or TGF-β + RA for 72hrs were assessed for FOXP3. Frequency of FOXP3+ cells is shown. A representative histogram and_means +/− SEM of 3 experiments are shown. (K) Naïve WT or CRABP2-deficient CD4 T cells activated with α-CD3/CD28 alone or with TGF-β or TGF-β + RA for 72hrs after 24hrs pre-activation without TGF-β + RA. FOXP3 was assessed and frequency of FOXP3+ cells assessed. A representative histogram and means +/− SEM of 3 experiments are shown. Student t-test was used for the statistical analysis. Where appropriate band intensity was quantified by ROD relative to control.
