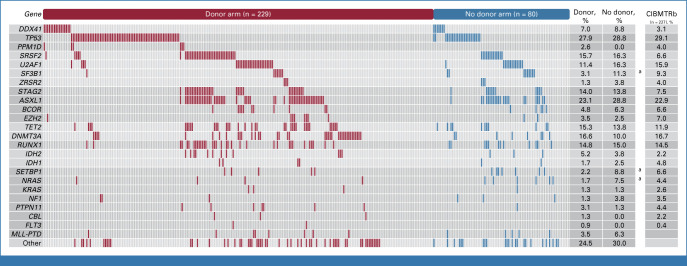
FIG 2.
Spectrum of myeloid driver mutations in the BMT CTN 1102 study. A comutation plot shows mutations in individual genes per study arm as labeled on the top. Mutations are depicted by colored bars and each column represents one of the 309 patients. aSignificant with P < .05 (Fisher's exact test). bSelection of patients with de novo MDS with IPSS intermediate-2 or high risk age 50-75 years from a matched retrospective cohort.3 BMT CTN, Blood and Marrow Transplant Clinical Trials Network; IPSS, International Prognostic Scoring System; MDS, myelodysplastic syndrome.

