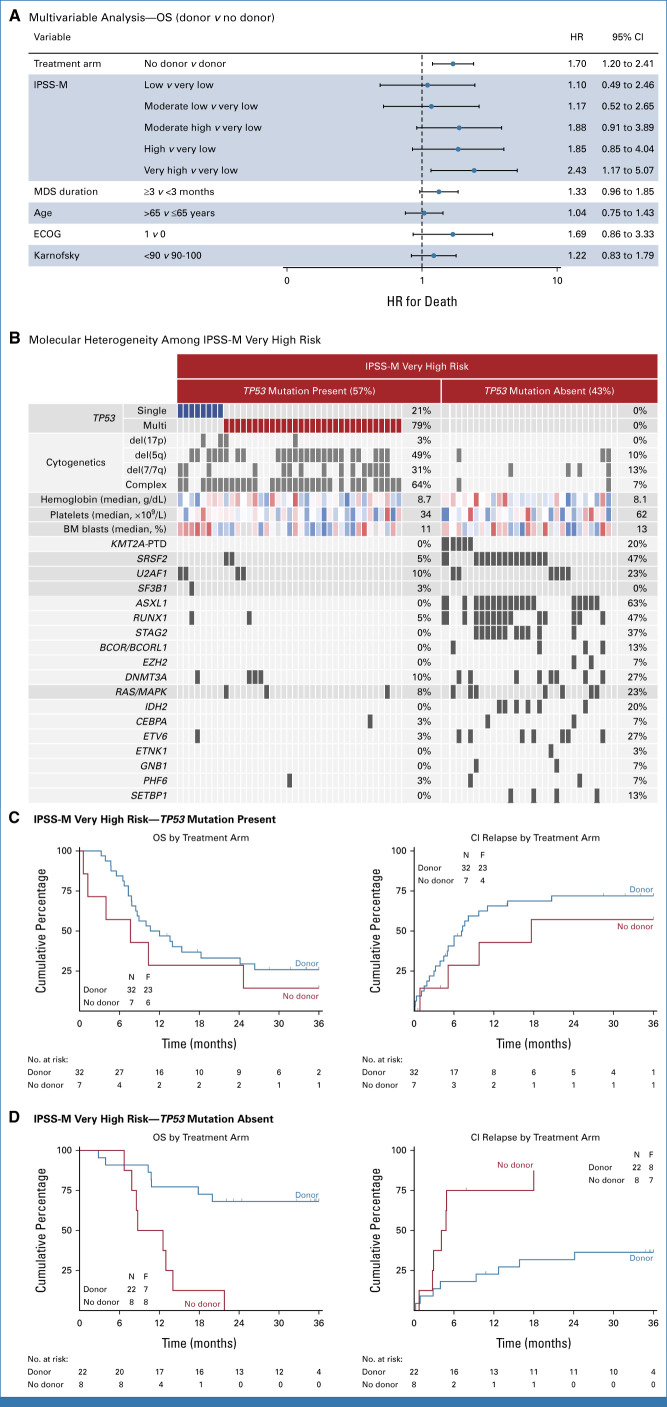
FIG 6.
Outcome based on IPSS-M risk classification. (A) Forest plot of subgroup analyses showing the hazard ratio for death and 95% CI in the intention-to-treat analysis of donor versus no donor. Multivariable Cox regression analysis was used, with adjustment for treatment arm, IPSS-M score, duration of disease, age, and performance score. (B) A comutation plot shows mutations in individual genes in patients with IPSS-M very high risk per TP53 mutation status as labeled on the top. Mutations, cytogenetic abnormalities, hemoglobin, platelet count, and bone marrow blasts are depicted by colored bars and each column represents one of the 69 patients. For hemoglobin, platelet count, and bone marrow blast, the color scheme ranges from red (high-risk value) to blue (low-risk value). (C) OS (left) and cumulative incidence of MDS relapse or progression to AML (right) by donor versus no donor comparison in patients with IPSS-M very high risk with a TP53 mutation. (D) OS (left) and cumulative incidence of MDS relapse or progression to AML (right) by donor versus no donor comparison in patients with IPSS-M very high risk without a TP53 mutation. Time is measured from consent. ECOG, Eastern Cooperative Oncology Group; HR, hazard ratio; IPSS-M, molecular International Prognostic Scoring System; MDS, myelodysplastic syndrome; OS, overall survival.

