FIGURE 4.

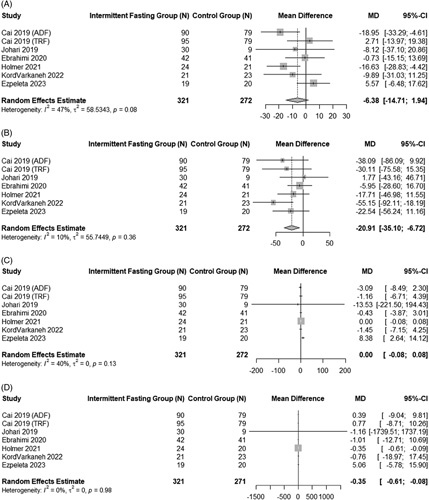
Pooled analysis of the impact of intermittent fasting on biochemical end points. Forest plots correspond to pooled analysis of total cholesterol (A), triglycerides (B), HDL (C), and LDL (D).

Pooled analysis of the impact of intermittent fasting on biochemical end points. Forest plots correspond to pooled analysis of total cholesterol (A), triglycerides (B), HDL (C), and LDL (D).