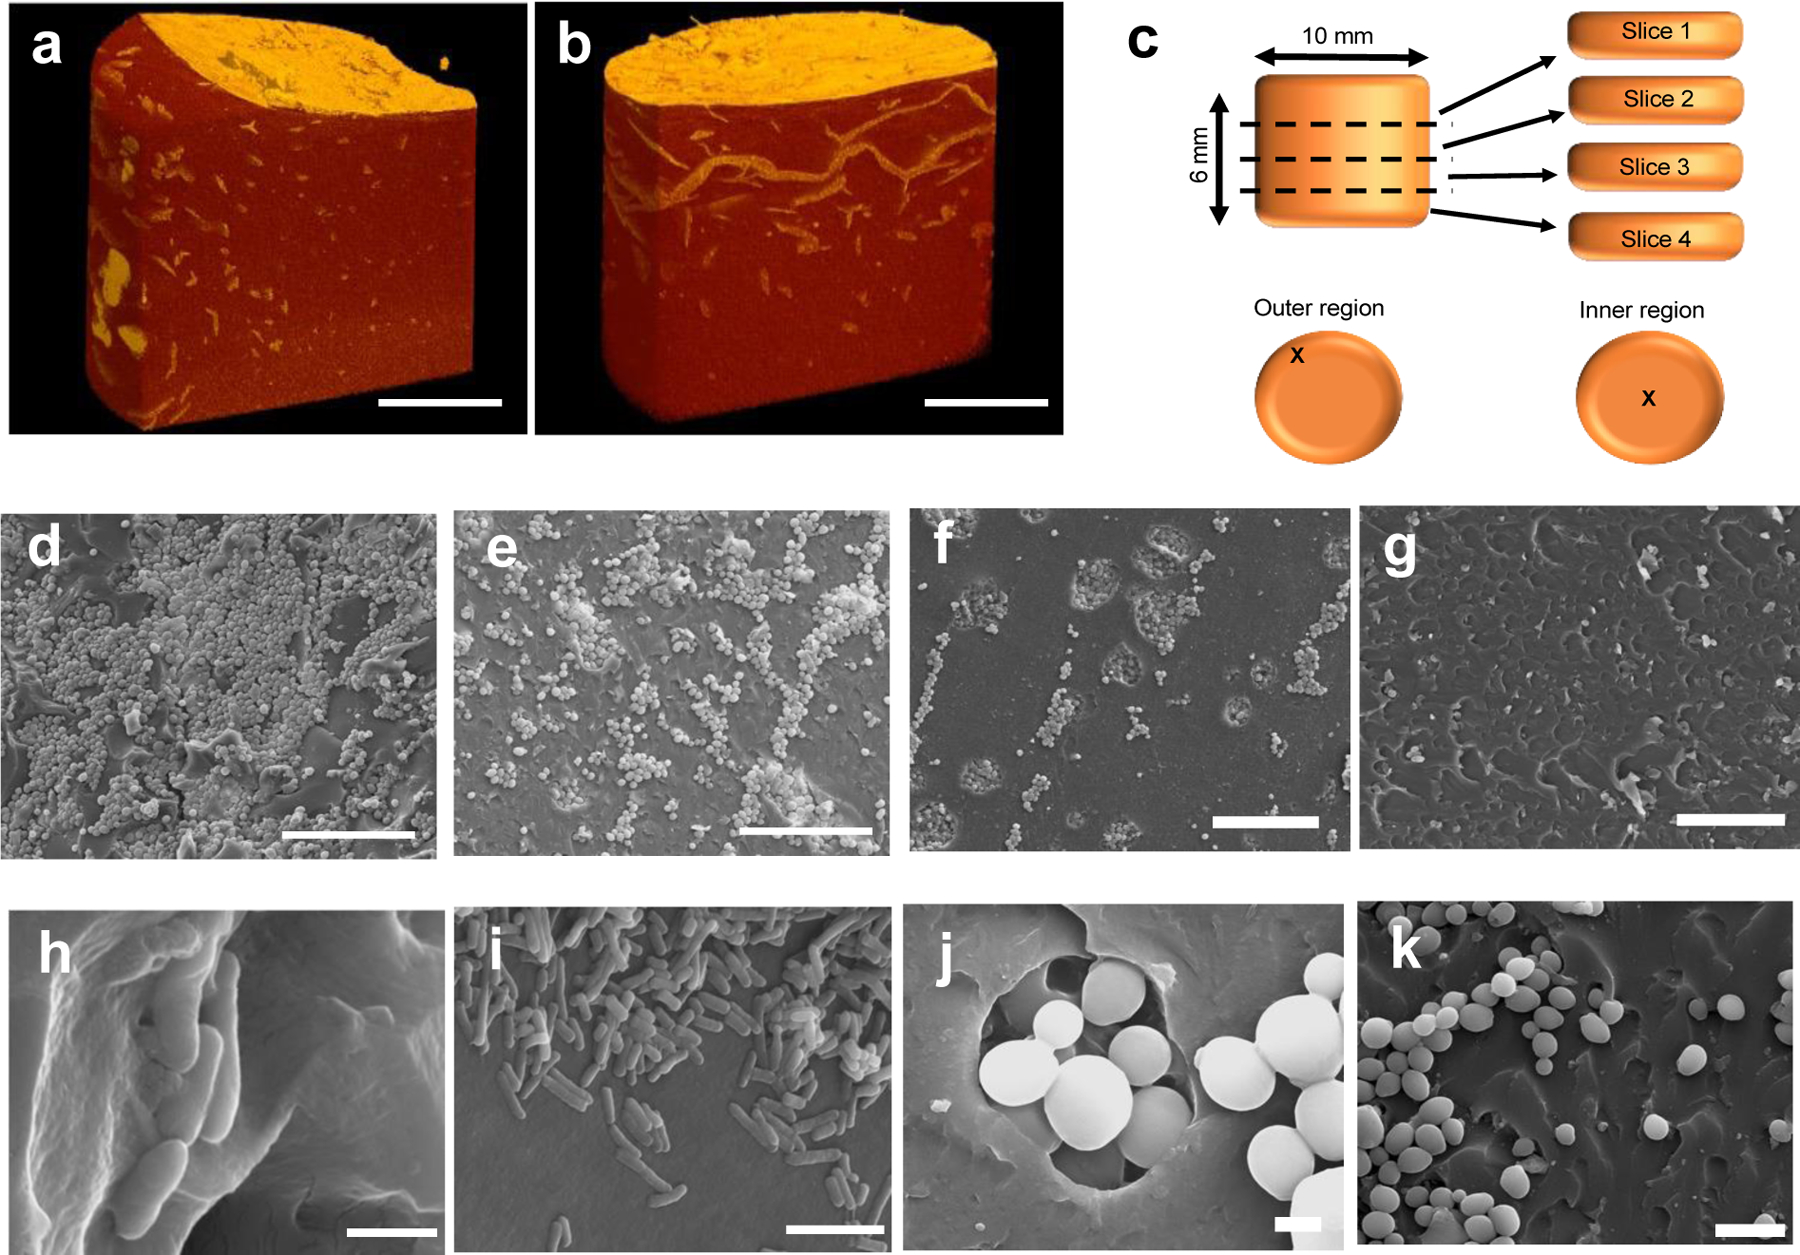
Figure 3.

Cell growth and distribution were observed using μCT and SEM imaging of the ELMs. μCT image of S. cerevisiae in ELM-SC-BXN hydrogel after a) 4 d and b) 21 d of culturing (scale bar = 50 μm). c) Illustration showing the sample sectioning that was performed to evaluate the distribution of the cells within different regions of a 3D printed cylindrical construct. SEM images of S. cerevisiae in a 3D printed cylindrical ELM-SC-BXN construct in: d) the outer region of slice 1 at 500x magnification (scale bar = 50 μm); e) the inner region of slice 1 at 500x magnification (scale bar = 50 μm); f) the outer region of slice 2 at 500x magnification (scale bar = 50 μm); and g) the inner region of slice 2 at 500x magnification (scale bar = 50 μm). SEM images of E. coli in a 3D printed cylindrical ELM-EC-LDOPA construct at h) 20000x magnification (scale bar = 1 μm) and i, 5000x (scale bar = 5 μm). SEM images of S. cerevisiae in a 3D printed cylindrical ELM-SC-BXN construct at j) 7000x magnification (scale bar = 2 μm) and k) at 2500x magnification (scale bar = 10 μm).
