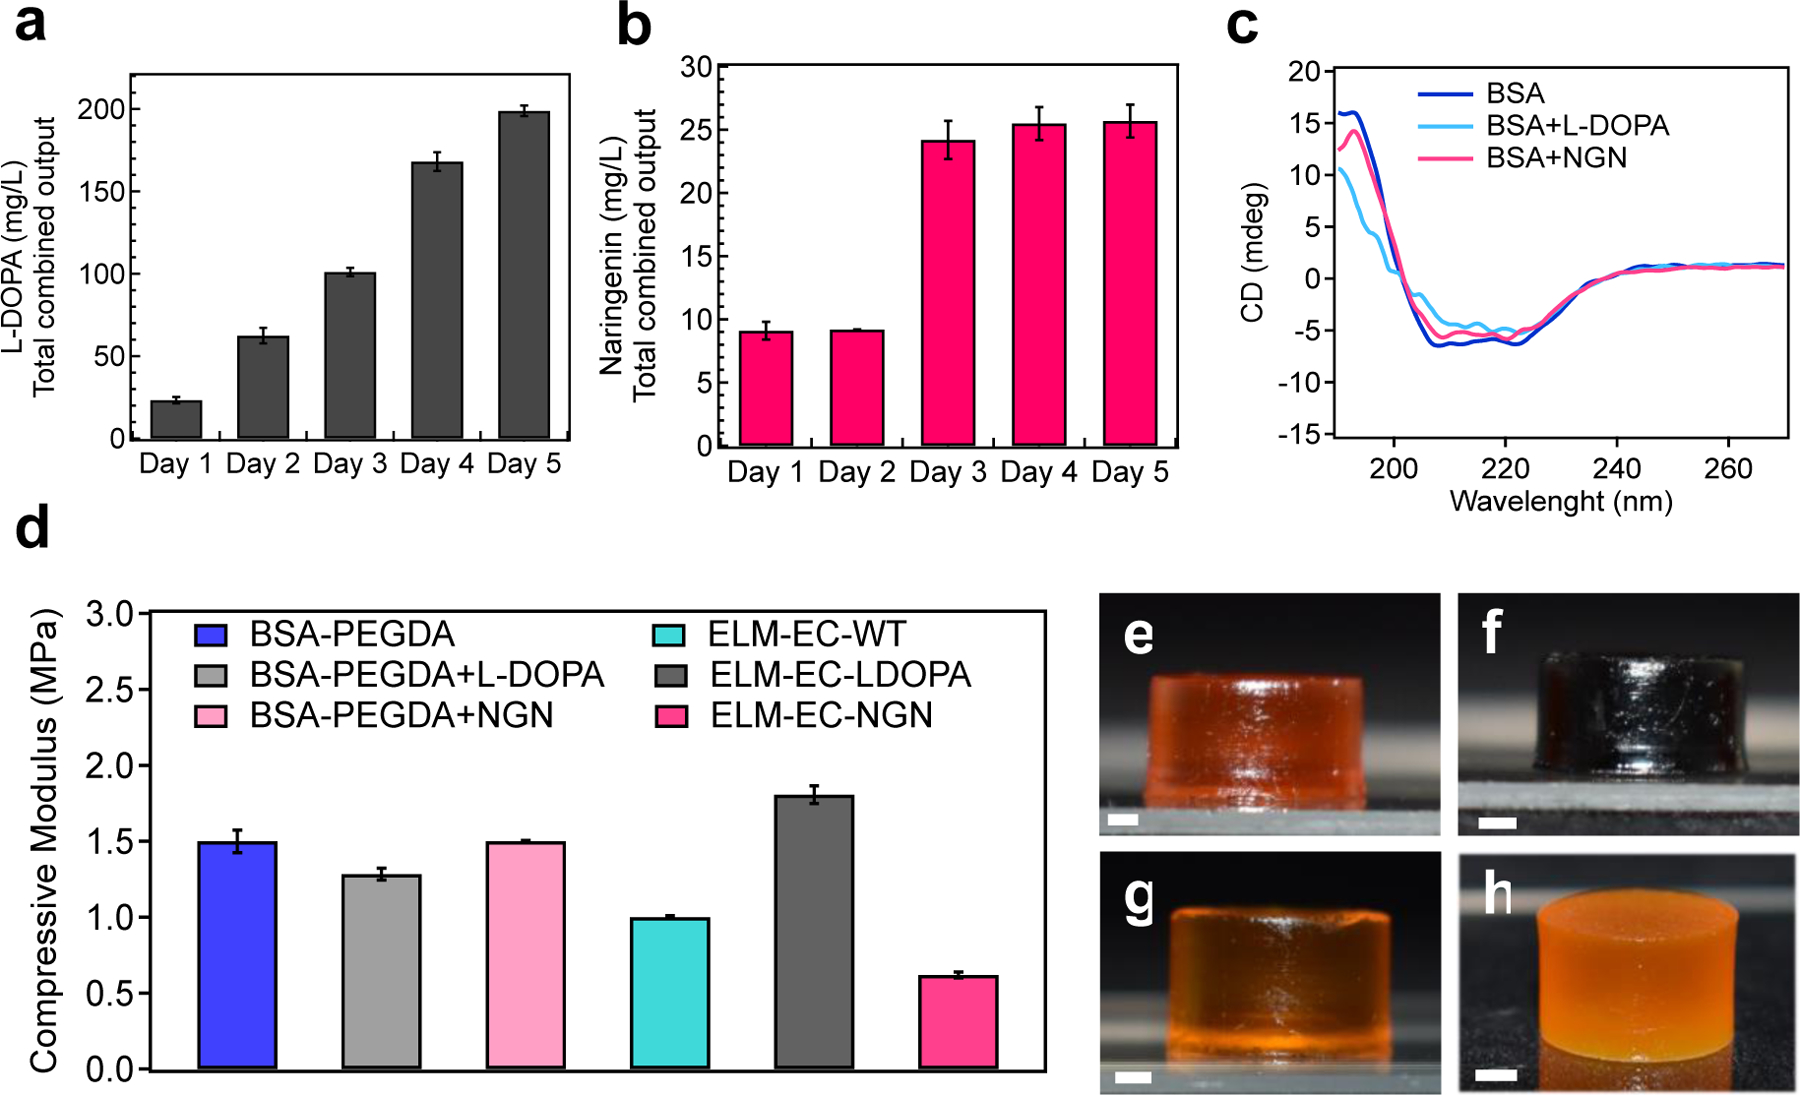
Figure 4.

The continuous production of naringenin and L-DOPA were monitored over time and their effect on ELM moduli were characterized. a) Graph showing continuous L-DOPA production from ELM-EC-LDOPA over 5 d. b) Graph showing continuous naringenin production from ELM-EC-NGN over 5 d. c) CD spectra of BSA, BSA+L-DOPA (wherein L-DOPA was exogenously added to a solution of BSA), and BSA+NGN (wherein naringenin was exogenously added to a solution of BSA). BSA showed a negative peak that reach a maximum between 222 to 208 nm, which corresponds to α–helical structure. In the BSA+L-DOPA sample, the maximum peak was observed between 222 to 217 nm which suggests that the α–helical structure of BSA was altered by the presence of L-DOPA, but not naringenin. d) Uniaxial compression experiments were performed to obtain the compressive moduli for BSA-PEGDA, BSA-PEGDA+L-DOPA, BSA-PEGDA+NGN, ELM-EC-WT, ELM-EC-LDOPA and ELM-EC-NGN.. Optical images of 3D printed cylindrical constructs after 5 d of culturing: e) BSA-PEGDA; f) ELM-EC-LDOPA; g) ELM-EC-NGN; h) ELM-SC-BXN. Statistical analysis: one-way ANOVA followed by Welch Test. Each data point represents the mean (n = 3) and error bars represent standard deviation.
