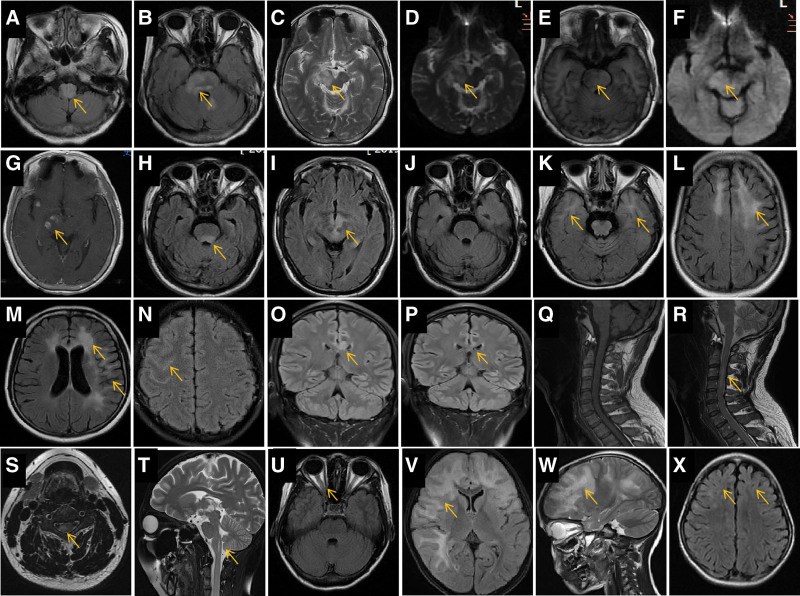
Figure 1.
Characteristics and lesion evolution in brain magnetic resonance imaging (MRI) of representative cases. •Patient 1. Initial brain MRI showing hyperintense regions in the bilateral medulla oblongata (A, arrow), pons (B, arrow), right pedunculus cerebri, and right midbrain (C, arrow) on fluid-attenuated inversion recovery (FLAIR, A and B, arrows), T2-weighted imaging (WI, C, arrow), and apparent diffusion coefficient (D, arrow), hypointense on T1WI (E, arrow), and without diffusion restriction on diffusion-weighted imaging (DWI, F). Several spot-like enhanced lesions are noted in the right pedunculus cerebri (G, arrow). •Patient 2. Initial MRI showing hyperintense regions in the bilateral dorsal pons (H, arrow), midbrain, and areas around the third ventricle (I, arrow) on FLAIR. The hyperintense signal in the brainstem FLAIR disappeared 1 mo later (J). •Patient 3. FLAIR MRI showing a hyperintense signal in the bilateral temporal poles (K, arrow), frontal white matter regions (L, arrow), anterior horns of the lateral ventricle (M, arrow), and cortical and subcortical regions in the left temporal lobe (M, arrow). •Patient 4. FLAIR MRI showing a hyperintense signal in the right frontotemporal lobe sulcus (N, arrow). •Patient 5. Initial FLAIR MRI showing a hyperintense signal in the corpus callosum body (O, arrow); the hyperintense signal nearly disappeared on MRI 3 mo later (P, arrow). •Patient 6. Initial sagittal T1WI MRI of the cervical spinal cord showing isointense signal (Q, arrow) and short, segmental hyperintense signal in the sagittal (R, arrow) and axial (S, arrow) T2WI. •Patient 7. MRI 1 mo after onset showing a small syringomyelia (T, arrow). •Patient 8. Brain MRI showing slight thickening of the right optic nerve (U, arrow). •Patient 9. MRI showing a large hyperintense area on T2WI in the bilateral frontotemporal lobes, mimicking a tumor (V and W, arrow); MRI performed 8 mo later showed that the abnormal signals nearly disappeared, with slight brain atrophy (X, arrows).

