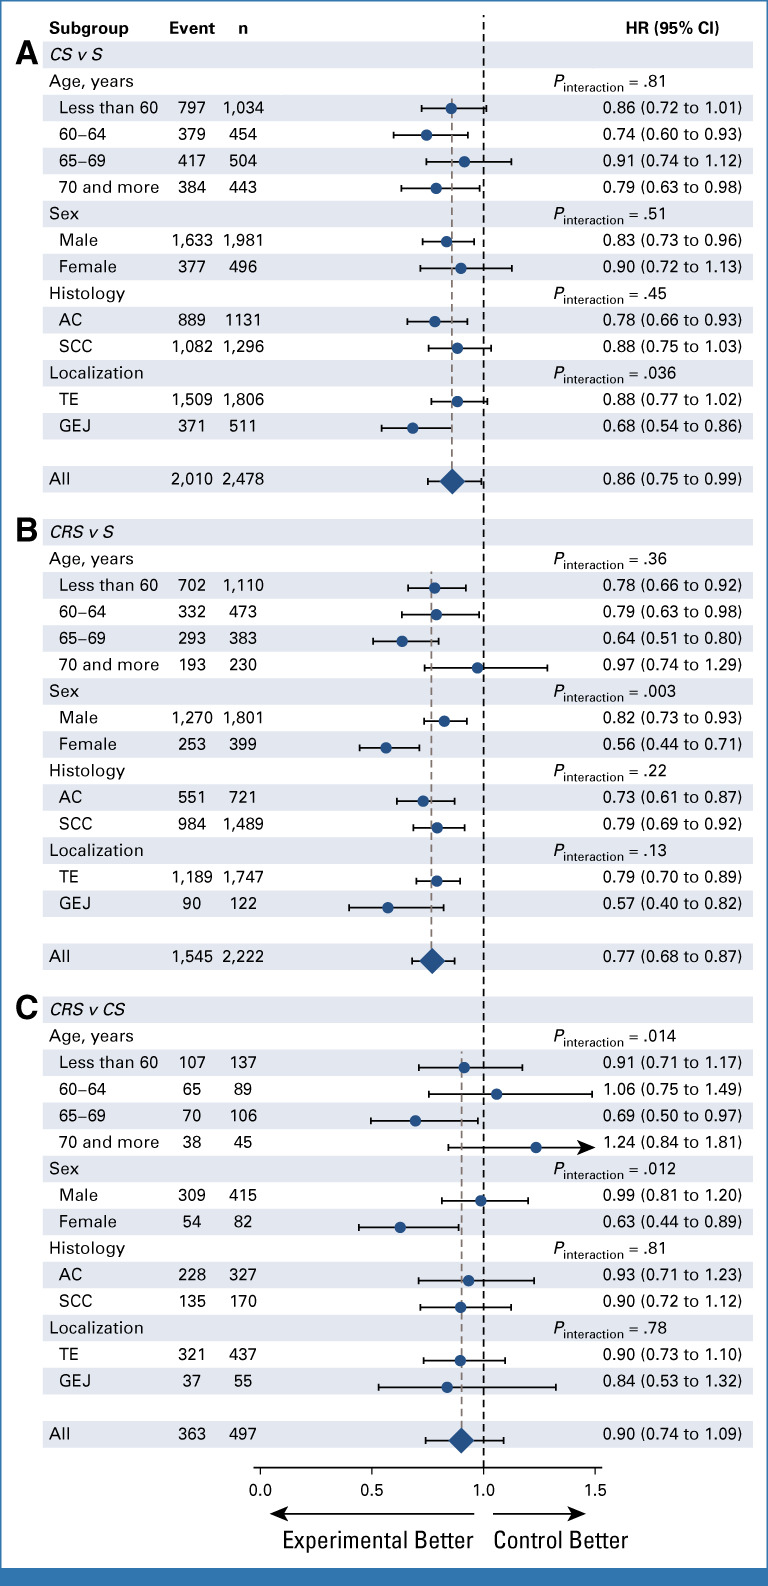
FIG 4.

Forest plot of the treatment effect on overall survival according to prespecified subgroups for (A) CS-S, (B) CRS-S, and (C) CRS-CS comparison. Number of patients (n) and number of events (event) are those from the complete case population of the direct comparisons, whereas HR and P values are from the full adjusted models. AC, adenocarcinoma; CRS, chemoradiotherapy followed by surgery; CS, chemotherapy followed by surgery; GEJ, gastroesophageal junction; HR, hazard ratio; S, surgery; SCC, squamous cell carcinoma; TE, thoracic esophagus.
