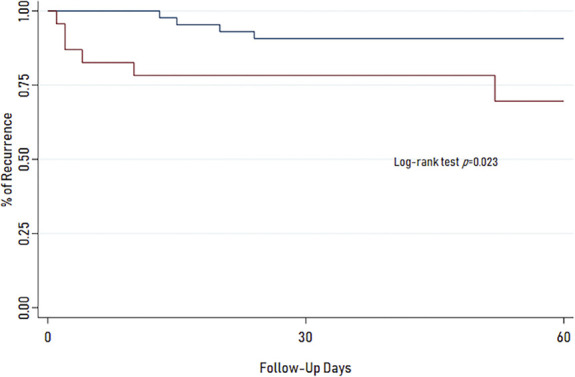
FIGURE 1.

Kaplan-Meier curves for no-AT and AT groups. Curves show time to end point of recurrence within 60 days. Survival curve for AT is significantly different from those in the no-AT group (P = .023, log-rank test). Blue line = no AT use and red line = AT use. AT, antithrombotic.
