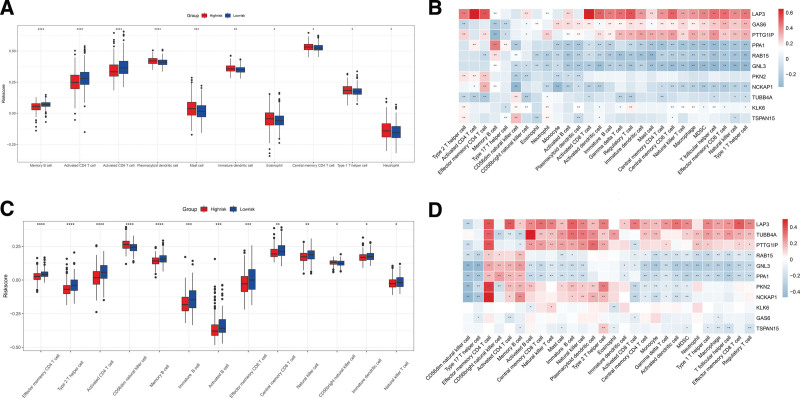
Figure 7.
Correlation between exosome-related risk model and immune microenvironment. (A) Differences in 28 immune infiltration cells between high- and low-risk groups in the training set. (B) The correlation between each exosome-related gene and each immune infiltration cell type in the training set. (C) Differences in 28 immune infiltration cells between high- and low-risk groups in the validation set. (D) The correlation between each exosome-related gene and each immune infiltration cell type in the validation set. (*P < .05; **P < .01; ***P < .001; ****P < .0001).

