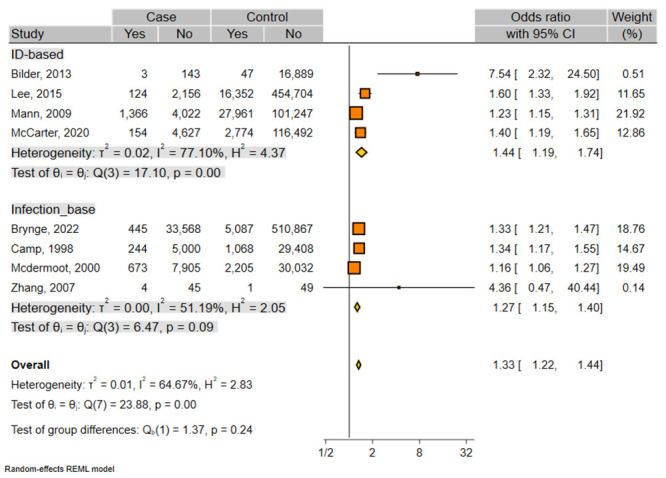
Fig 2. Forest plot for the association between maternal infection and ID.

Subgroups are based on different type of studies (infection-based- and ID-based- studies). The center of each square represents the OR, the area of the square is the weighted percentage in the meta-analysis and the horizontal line indicates the 95% CI. % weight: weight of each study compared with all the studies.
