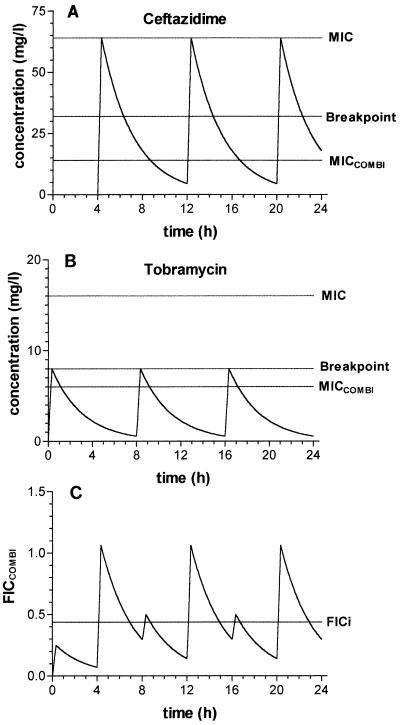
FIG. 2.
Representative concentration-versus-time curves for ceftazidime (A) and tobramycin (B) and the corresponding FICcombi-versus-time curve (C) during one combination therapy regimen. In this case the FICcombi curve, the MIC, and the MICcombi are based on data for P. aeruginosa CF 133. Breakpoints are according to NCCLS guidelines (19).

