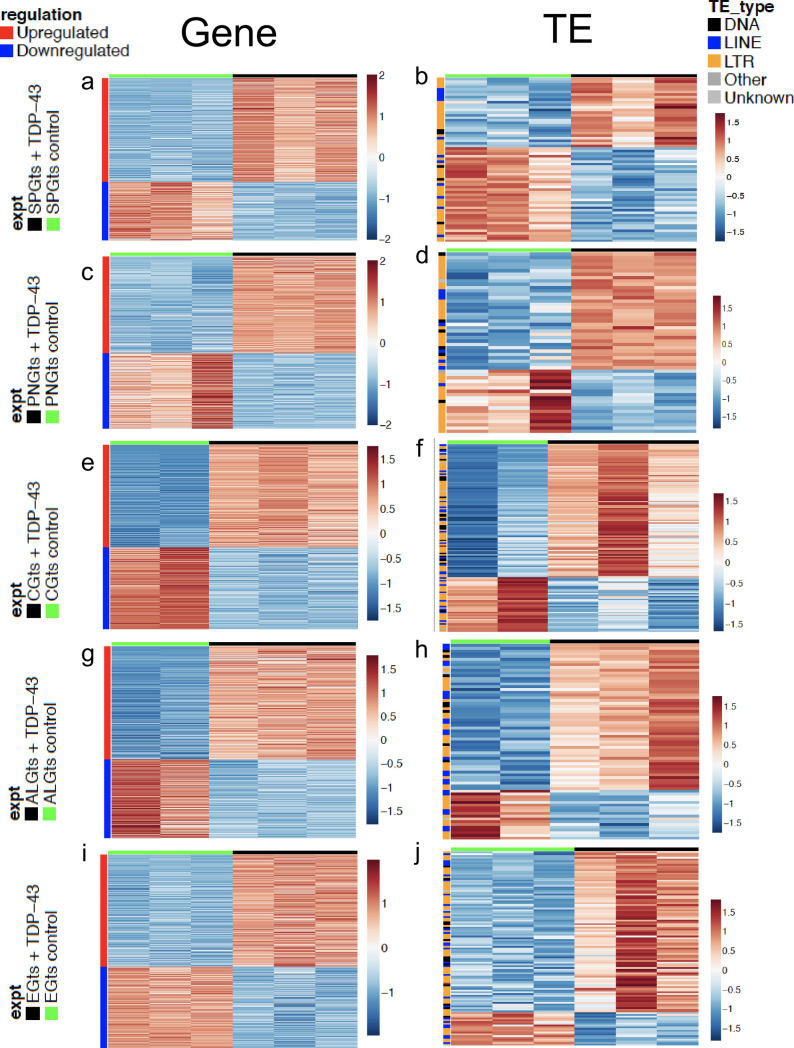
Fig 4. Differentially expressed genes and TEs in response to TDP-43 overexpression in each glial cell type.
Significantly (p < .05, see methods) upregulated (Red) and downregulated (Blue) genes (A,C,E,G,I) and TEs (B,D,F,H,J) are shown for TDP43 expressing (Green bar, left) vs control (Black bar, right) for each cell type. Genes or TEs that are significantly (p < .05) upregulated and downregulated are shown for PNG (A, B), SPG (C,D), CG (E,F), ALG (G,H) or and EG (I,J). Full genotypes and Gal4 lines are listed in methods.

