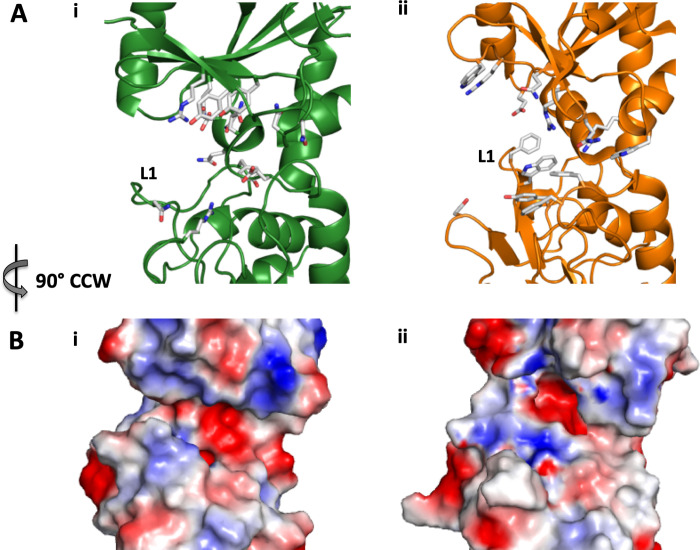
Fig 2. Comparison of the ligand-binding sites for FecB and FecB2.
Putative ligand-binding site of FecB (left panels) and FecB2 (right panels) show that the FecB2 ligand binding pocket is in a more open form compared to that of FecB. A. FecB and FecB2 are represented in cartoon form and colored as in Fig 1A with potential ligand-binding residues shown as white sticks. B. The electrostatic molecular surface for FecB and FecB2 was generated by APBS (Adaptive Poisson-Boltzmann Solver), where white, red and blue represent hydrophobic, negative and positively charged surfaces, respectively.

