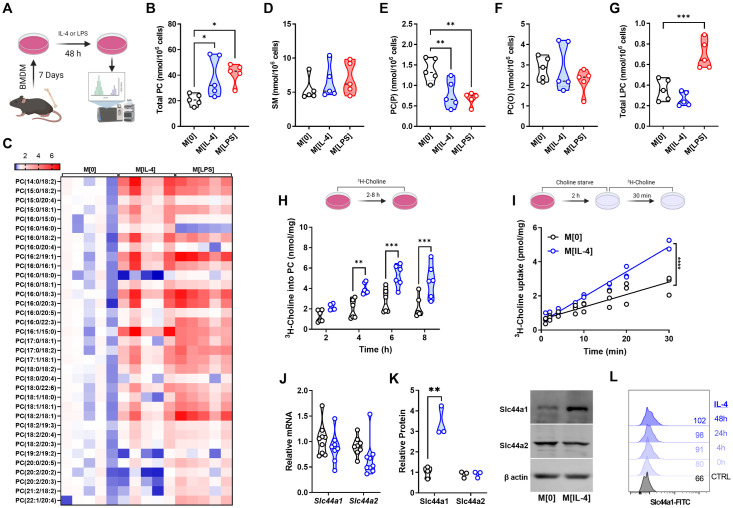
Fig 1. IL-4 up-regulates choline metabolism in macrophages.
A) Schematic of lipidomics analysis. B-G) Total PC content (B), heatmap of PC species (C), SM content (D), PC(O) content (E), PC(P) content (F), or total LPC content (G) for M[0], M[IL-4], or M[LPS] expressed as nmol per 106 cells. n = 5 per polarization. Heatmap statistics are shown as fold change over the average of M[0]. One-way ANOVA with Dunnett’s test for multiple comparisons (* p < 0.05, ** < 0.01). H) Incorporation of 3H-choline into phospholipids over time. n = 5 per timepoint, representative of 3 experiments. Two-way ANOVA with Šídák’s test for multiple comparisons (** p < 0.01, *** p < 0.001). I) Uptake of 3H-choline over time in M[0] or M[IL-4]. n = 3 per timepoint, representative of 3 experiments. Linear regression F test (**** p < 0.0001). J) Relative expression of Slc44a1 and Slc44a2 transcripts in M[0] or M[IL-4], normalized to Actb. n = 8 mice. K) Expression by Western blot of Slc44a1 and Slc44a2 in M[0] or M[IL-4]. Densitometry quantified relative to β-actin. n = 3, representative of 3 experiments. Unpaired t test (** p < 0.01). L) Expression of Slc44a1 by surface flow cytometry after different IL-4 stimulation times. Representative of 2 experiments. Schematics were created using BioRender.

