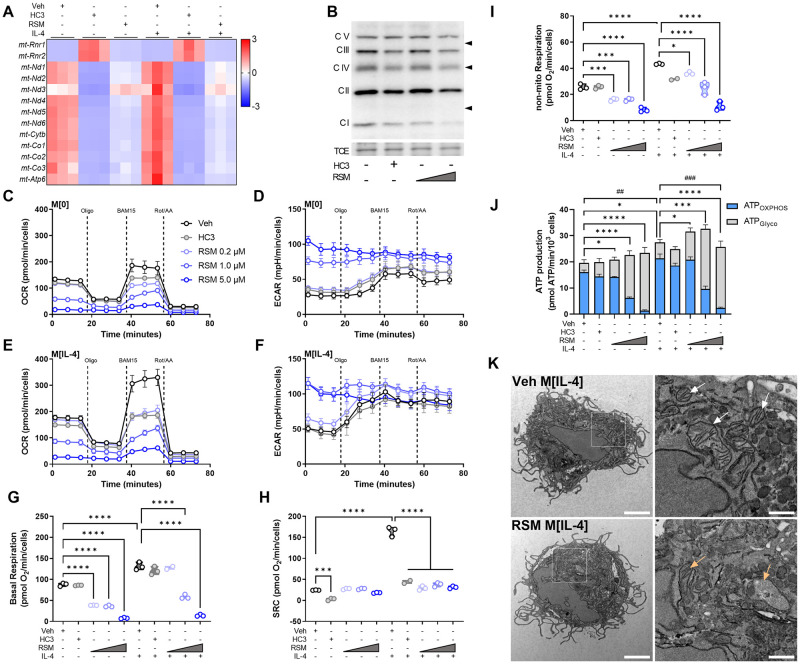
Fig 4. Inhibiting choline metabolism impairs mitochondrial structure and function.
A) Heatmap of z-scores for select mitochondrially-encoded genes. B) Western Blot of electron transport chain complexes I to V in macrophages treated with vehicle (DMSO), HC3 (250 μM), or RSM (1 or 5 μM). Total protein by trichloroethanol (TCE) staining shown for normalization. Representative blots of n = 3. C-I) Mito Stress Test assay of extracellular flux with sequential treatments of 1.5 μM oligomycin, 14 μM BAM15, and 1 μM rotenone/1 μM antimycin A/Hoechst 33342. Oxygen consumption rate (OCR) of M[0] (C) or M[IL-4] (E) treated with DMSO (Veh), HC3 (250 μM), or different concentrations of RSM. Extracellular acidification rate (ECAR) in M[0] (D) or M[IL-4] (E). Derived parameters of basal respiration (G), spare respiratory capacity (H), or non-mitochondrial respiration (I) from (C) and (E). Measurements (n = 3 in triplicate) were normalized to an arbitrary cell factor determined by Hoechst 33342 nuclei counts. One-way ANOVA with Šídák’s test for multiple comparisons (*** p < 0.001, **** p < 0.0001). J) Bioenergetics analysis of ATP produced through oxidative phosphorylation (ATPOXPHOS) or glycolysis (ATPGlyco). Measurements (n = 3 in triplicate) were normalized per 103 cells. Mixed-effects analysis with Tukey’s test for multiple comparisons (ATPOXPHOS: ## p < 0.01, ### p < 0.001; ATPGlyco: * p < 0.05, *** p < 0.001, **** p < 0.0001). K) Transmission electron micrographs of macrophages treated with vehicle (DMSO) or RSM (5 μM) in M[IL-4]. Scale bars represent 2 μM (left) or 0.5 μM (right insets). White arrows indicate healthy mitochondria with intact cristae, orange arrows indicate mitochondria with aberrant membrane structure or absent cristae. Representative images from n = 3 and at least 10 cells imaged per condition. No cells with intact mitochondria were observed with RSM treatment.

