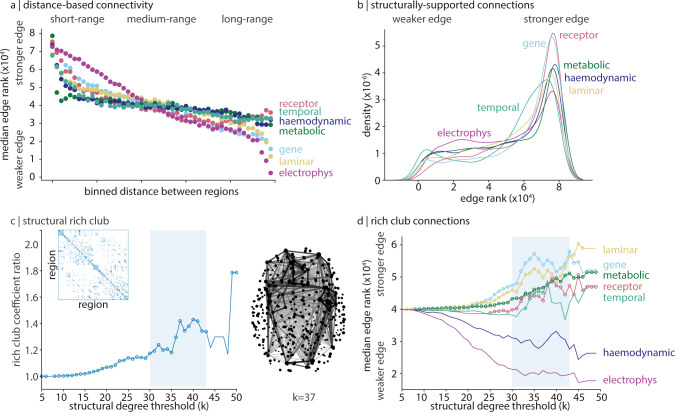
Fig 2. Structural and geometric features of connectivity modes.
To compare edge weights across networks, edges are rank-transformed. (a) Edges are binned into 50 equally sized bins of increasing Euclidean distance (79,800 edges total under the 400-region Schaefer parcellation, 1,596 edges per bin). For each connectivity mode, the median edge rank is plotted within each bin. (b) A kernel density estimation is applied on the rank-transformed feature similarity (edge rank) distribution of edges that also have a structural connection, for each connectivity mode. (c) For a structural degree threshold k ∈ [5, 50], we calculate the rich club coefficient ratio and show a characteristic increase in rich club coefficient ratio when 30 ≤ k ≤ 43. Circles indicate structural degree thresholds where the rich club coefficient ratio is significantly greater than a null distribution of ratios calculated using a degree-preserving rewired network (1,000 repetitions). On the right, we show the set of structural edges connecting regions with structural degree ≥37. Edge shade and thickness are proportional to edge weight, and point size is proportional to structural degree. The binary structural connectome is shown in the inset. (d) For each k ∈ [5, 50] and for each connectivity mode, we calculate the median edge rank of structurally-supported edges that connected regions with structural degree ≥ k. Circles indicate structural degree thresholds where the median rich-link edge rank of a connectivity mode is significantly greater than the edge rank of all other structurally supported edges (Welch’s t test, one-sided). The data underlying this figure can be found at https://github.com/netneurolab/hansen_many_networks.

